Audi 2010 Annual Report Download - page 139
Download and view the complete annual report
Please find page 139 of the 2010 Audi annual report below. You can navigate through the pages in the report by either clicking on the pages listed below, or by using the keyword search tool below to find specific information within the annual report.-
 1
1 -
2
-
3
-
4
-
5
-
6
-
7
-
8
-
9
-
10
-
11
-
12
-
13
-
14
-
15
-
16
-
17
-
18
-
19
-
20
-
21
-
22
-
23
-
24
-
25
-
26
-
27
-
28
-
29
-
30
-
31
-
32
-
33
-
34
-
35
-
36
-
37
-
38
-
39
-
40
-
41
-
42
-
43
-
44
-
45
-
46
-
47
-
48
-
49
-
50
-
51
-
52
-
53
-
54
-
55
-
56
-
57
-
58
-
59
-
60
-
61
-
62
-
63
-
64
-
65
-
66
-
67
-
68
-
69
-
70
-
71
-
72
-
73
-
74
-
75
-
76
-
77
-
78
-
79
-
80
-
81
-
82
-
83
-
84
-
85
-
86
-
87
-
88
-
89
-
90
-
91
-
92
-
93
-
94
-
95
-
96
-
97
-
98
-
99
-
100
-
101
-
102
-
103
-
104
-
105
-
106
-
107
-
108
-
109
-
110
-
111
-
112
-
113
-
114
-
115
-
116
-
117
-
118
-
119
-
120
-
121
-
122
-
123
-
124
-
125
-
126
-
127
-
128
-
 129
129 -
 130
130 -
 131
131 -
 132
132 -
 133
133 -
 134
134 -
 135
135 -
 136
136 -
 137
137 -
 138
138 -
 139
139 -
 140
140 -
 141
141 -
 142
142 -
 143
143 -
 144
144 -
 145
145 -
 146
146 -
 147
147 -
 148
148 -
 149
149 -
150
-
151
-
152
-
153
-
154
-
155
-
156
-
157
-
158
-
159
-
160
-
161
-
162
-
163
-
164
-
165
-
166
-
167
-
168
-
169
-
170
-
171
-
172
-
173
-
174
-
175
-
176
-
177
-
178
-
179
-
180
-
181
-
182
-
183
-
184
-
185
-
186
-
187
-
188
-
189
-
190
-
191
-
192
-
193
-
194
-
195
-
196
-
197
-
198
-
199
-
200
-
201
-
202
-
203
-
204
-
205
-
206
-
207
-
208
-
209
-
210
-
211
-
212
-
213
-
214
-
215
-
216
-
217
-
218
-
219
-
220
-
221
-
222
-
223
-
224
-
225
-
226
-
227
-
228
-
229
-
230
-
231
-
232
-
233
-
234
-
235
-
236
-
237
-
238
-
239
-
240
-
241
-
242
-
243
-
244
-
245
-
246
-
247
-
248
-
249
-
250
-
251
-
252
-
253
-
254
-
255
-
256
-
257
-
258
-
259
-
260
-
261
-
262
-
263
 |
 |

137
Management Report
132 Audi Group
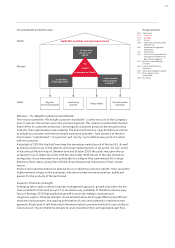
132 Structure
134 Strategy
137 Shares
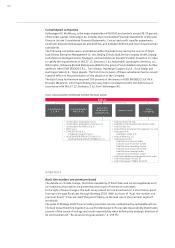
138 Disclosures required under
takeover law
140 Corporate management
declaration
140 Compliance
141 System of remuneration for
the Supervisory Board and
Board of Management
141 Business and underlying
situation
156 Financial performance
indicators
159 Social and ecological aspects
173 Risks, opportunities
and outlook
183 Disclaimer
As well as being able to offer them challenging tasks, the Audi Group provides its personnel with
attractive working conditions, commensurate pay and high job security.
Regular internal surveys of the workforce confirm a high level of employee satisfaction. Numerous
external surveys have additionally confirmed the high appeal of the Audi Group as an employer –
in 2010 AUDI AG was voted the most attractive employer in such leading graduate surveys as
those conducted by the consultants trendence and Universum among both engineering and
business students (“trendence Graduate Barometer 2010 – Business and Engineering Edition,”
May 21, 2010; “Universum Student Survey 2010 – Germany,” May 3, 2010).
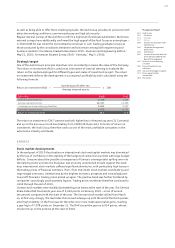
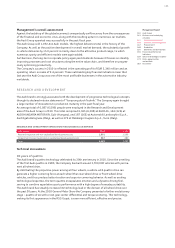
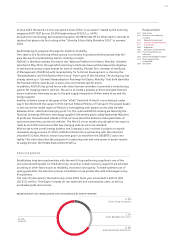
Strategic target
One of the Audi Group’s principal objectives is to consistently increase the value of the Company.
The return on investment (RoI) is used as an instrument of internal steering to evaluate the
return on the capital employed for different types and scales of investment project. The return
on investment reflects the development in a company’s profitability and is calculated using the
following formula:
Operating profit after tax
Average invested assets
Return on investment (RoI) = x 100
EUR million 2010 2009
Operating profit after tax 2,338 1,123
Average operating assets 13,327 13,329
– Average non-interest-bearing liabilities 3,855 3,557
= Average invested assets 9,472 9,772
Return on investment (in %) 24.7 11.5
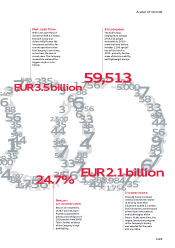
The return on investment of 24.7 percent was both higher than in the previous year (11.5 percent)
and up on the previous record level dating from 2008 (19.8 percent). In terms of return on
investment, the Audi Group therefore ranks as one of the most profitable companies in the
automotive industry worldwide.
SHARES
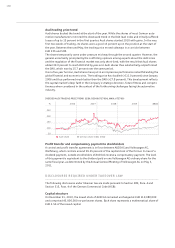
Stock market developments
In the early part of 2010 the situation on international stock and capital markets was dominated
by the loss of confidence in the stability of the budgets of certain EU countries with large budget
deficits. Concerns about the possible consequences of Greece’s sovereign debt spilling over into
the banking sector and into the European real economy undermined morale. Against this back-
drop international stock markets suffered significant downturns, with particularly high losses in
the trading prices of financial institutes. Then, from mid-2010, stock markets worldwide by and
large staged a recovery. Underpinned by the brighter economic prospects and increasingly posi-
tive profit forecasts, trading prices picked up again. The positive trend was further bolstered by
companies’ surprisingly good quarterly figures. Trading prices worldwide therefore continued to
climb through the end of 2010.
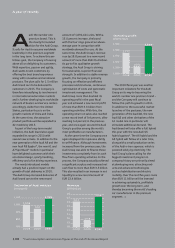
German stock markets were initially dominated by price losses at the start of the year. The German
Share Index DAX touched its year-low of 5,434 points in February 2010 – a loss of around
ten percent compared with the start of the year. The German stock market rallied from March
on, at first very strongly. The lead index then moved sideways up until the end of the third quarter,
amid high volatility. In the final quarter the index once more made appreciable gains, reaching
a year-high of 7,078 points on December 21. The DAX closed the year on 6,914 points, almost
16 percent up on the position at the start of 2010.