Audi 2010 Annual Report Download - page 225
Download and view the complete annual report
Please find page 225 of the 2010 Audi annual report below. You can navigate through the pages in the report by either clicking on the pages listed below, or by using the keyword search tool below to find specific information within the annual report.-
 1
1 -
2
-
3
-
4
-
5
-
6
-
7
-
8
-
9
-
10
-
11
-
12
-
13
-
14
-
15
-
16
-
17
-
18
-
19
-
20
-
21
-
22
-
23
-
24
-
25
-
26
-
27
-
28
-
29
-
30
-
31
-
32
-
33
-
34
-
35
-
36
-
37
-
38
-
39
-
40
-
41
-
42
-
43
-
44
-
45
-
46
-
47
-
48
-
49
-
50
-
51
-
52
-
53
-
54
-
55
-
56
-
57
-
58
-
59
-
60
-
61
-
62
-
63
-
64
-
65
-
66
-
67
-
68
-
69
-
70
-
71
-
72
-
73
-
74
-
75
-
76
-
77
-
78
-
79
-
80
-
81
-
82
-
83
-
84
-
85
-
86
-
87
-
88
-
89
-
90
-
91
-
92
-
93
-
94
-
95
-
96
-
97
-
98
-
99
-
100
-
101
-
102
-
103
-
104
-
105
-
106
-
107
-
108
-
109
-
110
-
111
-
112
-
113
-
114
-
115
-
116
-
117
-
118
-
119
-
120
-
121
-
122
-
123
-
124
-
125
-
126
-
127
-
128
-
129
-
130
-
131
-
132
-
133
-
134
-
135
-
136
-
137
-
138
-
139
-
140
-
141
-
142
-
143
-
144
-
145
-
146
-
147
-
148
-
149
-
150
-
151
-
152
-
153
-
154
-
155
-
156
-
157
-
158
-
159
-
160
-
161
-
162
-
163
-
164
-
165
-
166
-
167
-
168
-
169
-
170
-
171
-
172
-
173
-
174
-
175
-
176
-
177
-
178
-
179
-
180
-
181
-
182
-
183
-
184
-
185
-
186
-
187
-
188
-
189
-
190
-
191
-
192
-
193
-
194
-
195
-
196
-
197
-
198
-
199
-
200
-
201
-
202
-
203
-
204
-
205
-
206
-
207
-
208
-
209
-
210
-
211
-
212
-
213
-
214
-
 215
215 -
 216
216 -
 217
217 -
 218
218 -
 219
219 -
 220
220 -
 221
221 -
 222
222 -
 223
223 -
 224
224 -
 225
225 -
 226
226 -
 227
227 -
 228
228 -
 229
229 -
 230
230 -
 231
231 -
 232
232 -
 233
233 -
 234
234 -
 235
235 -
236
-
237
-
238
-
239
-
240
-
241
-
242
-
243
-
244
-
245
-
246
-
247
-
248
-
249
-
250
-
251
-
252
-
253
-
254
-
255
-
256
-
257
-
258
-
259
-
260
-
261
-
262
-
263
 |
 |
223
Consolidated Financial
Statements
184 Income Statement
185 Statement of Recognized
Income and Expense
186 Balance Sheet
187 Cash Flow Statement
188 Statement of Changes in Equity
Notes to the Consolidated
Financial Statements
190 Development of fixed assets
in the 2010 fiscal year
192 Development of fixed assets
in the 2009 fiscal year
194 General information
200 Recognition and
measurement principles
207 Notes to the Income Statement
214 Notes to the Balance Sheet
217 Liabilities
223 Additional disclosures
242 Events occurring subsequent
to the balance sheet date
243 Statement of Interests
held by the Audi Group
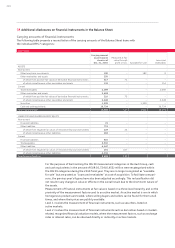
31 Trade payables
EUR million Dec. 31, 2010 Dec. 31, 2009
Trade payables to
third parties 2,986 2,592
affiliated companies 511 512
associated companies and participating interests 13 9
Total 3,510 3,114
The fair values of the trade payables correspond to the carrying amounts due to their short-term
nature.
The customary retention of title applies to liabilities from deliveries of goods.
ADDITIONAL DISCLOSURES
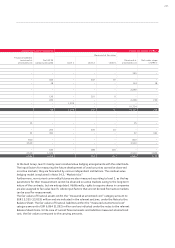
32 Capital management
The primary goal of capital management within the Audi Group is to assure financial flexibility in
order to achieve business and growth targets, and to enable continuous, steady growth in the
value of the Company. In particular, management is focused on achieving the minimum return
demanded by the capital market on the invested assets. The capital structure is steered specifi-
cally with this in mind, and the economic environment is kept under constant observation. The
objectives, methods and procedures for optimizing capital management remained unchanged at
December 31, 2010. For this purpose, the development of key cost and value factors are analyzed
regularly; appropriate optimization measures are then defined and their implementation is
monitored on an ongoing basis. To ensure that resources are deployed as efficiently as possible,
and to measure success in this regard, the Audi Group has been using the return on investment
as an indicator based on capital expenditure for several years now.
The equity and financial liabilities from the transfer of profit are summarized in the following
table:
EUR million Dec. 31, 2010 Dec. 31, 2009
Equity 11,310 10,632
as % of total capital 80 86
Financial liabilities from the transfer of profit 2,835 1,751
Current financial liabilities 810 577
Non-current financial liabilities 15 2
Liabilities from the transfer of profit 2,010 1,172
as % of total capital 20 14
Total capital 14,144 12,383
Around 99.55 percent of the issued capital is held by Volkswagen AG, Wolfsburg, with which a
control and profit transfer agreement exists.
In the 2010 fiscal year, equity rose by 6.4 percent compared with the prior year. This is primarily
due to the allocation to other retained earnings and a cash injection to the capital reserve by
Volkswagen AG.