Allstate 2014 Annual Report Download - page 63
Download and view the complete annual report
Please find page 63 of the 2014 Allstate annual report below. You can navigate through the pages in the report by either clicking on the pages listed below, or by using the keyword search tool below to find specific information within the annual report.-
 1
1 -
2
-
3
-
4
-
5
-
6
-
7
-
8
-
9
-
10
-
11
-
12
-
13
-
14
-
15
-
16
-
17
-
18
-
19
-
20
-
21
-
22
-
23
-
24
-
25
-
26
-
27
-
28
-
29
-
30
-
31
-
32
-
33
-
34
-
35
-
36
-
37
-
38
-
39
-
40
-
41
-
42
-
43
-
44
-
45
-
46
-
47
-
48
-
49
-
50
-
51
-
52
-
 53
53 -
 54
54 -
 55
55 -
 56
56 -
 57
57 -
 58
58 -
 59
59 -
 60
60 -
 61
61 -
 62
62 -
 63
63 -
 64
64 -
 65
65 -
 66
66 -
 67
67 -
 68
68 -
 69
69 -
 70
70 -
 71
71 -
 72
72 -
 73
73 -
74
-
75
-
76
-
77
-
78
-
79
-
80
-
81
-
82
-
83
-
84
-
85
-
86
-
87
-
88
-
89
-
90
-
91
-
92
-
93
-
94
-
95
-
96
-
97
-
98
-
99
-
100
-
101
-
102
-
103
-
104
-
105
-
106
-
107
-
108
-
109
-
110
-
111
-
112
-
113
-
114
-
115
-
116
-
117
-
118
-
119
-
120
-
121
-
122
-
123
-
124
-
125
-
126
-
127
-
128
-
129
-
130
-
131
-
132
-
133
-
134
-
135
-
136
-
137
-
138
-
139
-
140
-
141
-
142
-
143
-
144
-
145
-
146
-
147
-
148
-
149
-
150
-
151
-
152
-
153
-
154
-
155
-
156
-
157
-
158
-
159
-
160
-
161
-
162
-
163
-
164
-
165
-
166
-
167
-
168
-
169
-
170
-
171
-
172
-
173
-
174
-
175
-
176
-
177
-
178
-
179
-
180
-
181
-
182
-
183
-
184
-
185
-
186
-
187
-
188
-
189
-
190
-
191
-
192
-
193
-
194
-
195
-
196
-
197
-
198
-
199
-
200
-
201
-
202
-
203
-
204
-
205
-
206
-
207
-
208
-
209
-
210
-
211
-
212
-
213
-
214
-
215
-
216
-
217
-
218
-
219
-
220
-
221
-
222
-
223
-
224
-
225
-
226
-
227
-
228
-
229
-
230
-
231
-
232
-
233
-
234
-
235
-
236
-
237
-
238
-
239
-
240
-
241
-
242
-
243
-
244
-
245
-
246
-
247
-
248
-
249
-
250
-
251
-
252
-
253
-
254
-
255
-
256
-
257
-
258
-
259
-
260
-
261
-
262
-
263
-
264
-
265
-
266
-
267
-
268
-
269
-
270
-
271
-
272
-
273
-
274
-
275
-
276
-
277
-
278
-
279
-
280
 |
 |

9MAR201204034531
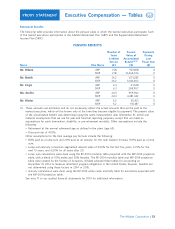
Executive Compensation — Tables
Retirement Benefits
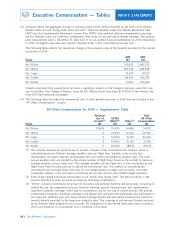
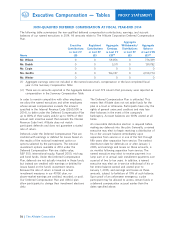
The following table provides information about the pension plans in which the named executives participate. Each
of the named executives participates in the Allstate Retirement Plan (ARP) and the Supplemental Retirement
Income Plan (SRIP).
PENSION BENEFITS
Mr. Wilson ARP 21.8 923,818 0
SRIP 21.8 12,465,076 0
Mr. Shebik ARP 26.2 1,131,283 0
SRIP 26.2 3,146,402 0
Mr. Civgin ARP 6.3 41,528 0
SRIP 6.3 268,907 0
Ms. Greffin ARP 24.3 959,962 0
SRIP 24.3 4,481,342 0
Mr. Winter ARP 5.2 30,421 0
SRIP 5.2 315,187 0
(1) These amounts are estimates and do not necessarily reflect the actual amounts that will be paid to the
named executives, which will be known only at the time they become eligible for payment. The present value
of the accumulated benefit was determined using the same measurement date (December 31, 2014) and
material assumptions that we use for year-end financial reporting purposes, except that we made no
assumptions for early termination, disability, or pre-retirement mortality. Other assumptions include the
following:
• Retirement at the normal retirement age as defined in the plans (age 65).
• Discount rate of 4.10%.
Other assumptions for the final average pay formula include the following:
• 80% paid as a lump sum and 20% paid as an annuity; for the cash balance formula, 100% paid as a lump
sum.
• Lump-sum/annuity conversion segmented interest rates of 3.50% for the first five years, 5.75% for the
next 15 years, and 6.50% for all years after 20.
• Lump sum calculations were done using the RP-2014 mortality table projected with the MP-2014 projection
table, with a blend of 50% males and 50% females. The RP-2014 mortality table and MP-2014 projection
table were created by the Society of Actuaries. Allstate adopted these tables for accounting on
December 31, 2014 to measure retirement program obligations in the United States; however, benefits are
not determined using these factors in 2014 or 2015.
• Annuity calculations were done using the RP-2014 white collar mortality table for annuitants projected with
the MP-2014 projection table.
See note 17 to our audited financial statements for 2014 for additional information.
53
PROXY STATEMENT
Number of Present Payments
Years Value of During
Credited Accumulated Last
Service Benefit(1)(2) Fiscal Year
Name Plan Name (#) ($) ($)
The Allstate Corporation