Allstate 2014 Annual Report Download - page 184
Download and view the complete annual report
Please find page 184 of the 2014 Allstate annual report below. You can navigate through the pages in the report by either clicking on the pages listed below, or by using the keyword search tool below to find specific information within the annual report.-
 1
1 -
2
-
3
-
4
-
5
-
6
-
7
-
8
-
9
-
10
-
11
-
12
-
13
-
14
-
15
-
16
-
17
-
18
-
19
-
20
-
21
-
22
-
23
-
24
-
25
-
26
-
27
-
28
-
29
-
30
-
31
-
32
-
33
-
34
-
35
-
36
-
37
-
38
-
39
-
40
-
41
-
42
-
43
-
44
-
45
-
46
-
47
-
48
-
49
-
50
-
51
-
52
-
53
-
54
-
55
-
56
-
57
-
58
-
59
-
60
-
61
-
62
-
63
-
64
-
65
-
66
-
67
-
68
-
69
-
70
-
71
-
72
-
73
-
74
-
75
-
76
-
77
-
78
-
79
-
80
-
81
-
82
-
83
-
84
-
85
-
86
-
87
-
88
-
89
-
90
-
91
-
92
-
93
-
94
-
95
-
96
-
97
-
98
-
99
-
100
-
101
-
102
-
103
-
104
-
105
-
106
-
107
-
108
-
109
-
110
-
111
-
112
-
113
-
114
-
115
-
116
-
117
-
118
-
119
-
120
-
121
-
122
-
123
-
124
-
125
-
126
-
127
-
128
-
129
-
130
-
131
-
132
-
133
-
134
-
135
-
136
-
137
-
138
-
139
-
140
-
141
-
142
-
143
-
144
-
145
-
146
-
147
-
148
-
149
-
150
-
151
-
152
-
153
-
154
-
155
-
156
-
157
-
158
-
159
-
160
-
161
-
162
-
163
-
164
-
165
-
166
-
167
-
168
-
169
-
170
-
171
-
172
-
173
-
 174
174 -
 175
175 -
 176
176 -
 177
177 -
 178
178 -
 179
179 -
 180
180 -
 181
181 -
 182
182 -
 183
183 -
 184
184 -
 185
185 -
 186
186 -
 187
187 -
 188
188 -
 189
189 -
 190
190 -
 191
191 -
 192
192 -
 193
193 -
 194
194 -
195
-
196
-
197
-
198
-
199
-
200
-
201
-
202
-
203
-
204
-
205
-
206
-
207
-
208
-
209
-
210
-
211
-
212
-
213
-
214
-
215
-
216
-
217
-
218
-
219
-
220
-
221
-
222
-
223
-
224
-
225
-
226
-
227
-
228
-
229
-
230
-
231
-
232
-
233
-
234
-
235
-
236
-
237
-
238
-
239
-
240
-
241
-
242
-
243
-
244
-
245
-
246
-
247
-
248
-
249
-
250
-
251
-
252
-
253
-
254
-
255
-
256
-
257
-
258
-
259
-
260
-
261
-
262
-
263
-
264
-
265
-
266
-
267
-
268
-
269
-
270
-
271
-
272
-
273
-
274
-
275
-
276
-
277
-
278
-
279
-
280
 |
 |

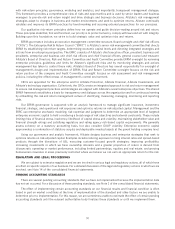
CAPITAL RESOURCES AND LIQUIDITY
Capital resources consist of shareholders’ equity and debt, representing funds deployed or available to be deployed
to support business operations or for general corporate purposes. The following table summarizes our capital resources
as of December 31.
($ in millions) 2014 2013 2012
Preferred stock, common stock, retained income
and other shareholders’ equity items $ 21,743 $ 20,434 $ 19,405
Accumulated other comprehensive income 561 1,046 1,175
Total shareholders’ equity 22,304 21,480 20,580
Debt 5,194 6,201 6,057
Total capital resources $ 27,498 $ 27,681 $ 26,637
Ratio of debt to shareholders’ equity 23.3% 28.9% 29.4%
Ratio of debt to capital resources 18.9% 22.4% 22.7%
Shareholders’ equity increased in 2014, primarily due to net income, the issuance of preferred stock and increased
unrealized net capital gains on investments, partially offset by common share repurchases, an increase in the
unrecognized pension and other postretirement benefit cost and dividends paid to shareholders. In 2014, we paid
dividends of $477 million and $87 million related to our common and preferred shares, respectively. Shareholders’
equity increased in 2013, primarily due to net income, decreased unrecognized pension and other postretirement benefit
cost, and the issuance of preferred stock, partially offset by common share repurchases, decreased unrealized net
capital gains on investments and dividends paid to shareholders.
Preferred stock In March 2014, we issued 29,900 shares of 6.625% Noncumulative Perpetual Preferred Stock for
gross proceeds of $747.5 million. In June 2014, we issued 10,000 shares of 6.25% Noncumulative Perpetual Preferred
Stock for gross proceeds of $250 million. The proceeds of both issuances were used for general corporate purposes.
Debt $300 million of 6.20% Senior Notes were paid at maturity in May 2014 and $650 million of 5.00% Senior
Notes were paid at maturity in August 2014. These Notes were paid from available funds. We have no debt maturities
until 2018. As of December 31, 2014 and 2013, there were no outstanding commercial paper borrowings. For further
information on outstanding debt, see Note 12 of the consolidated financial statements.
Capital resources comprise an increased mix of preferred stock and subordinated debt due to issuances in 2013 and
2014 and the completion of a tender offer to repurchase debt in 2013. As of December 31, 2014, capital resources
includes $1.75 billion or 6.3% of preferred stock and $2.05 billion or 7.5% of subordinated debt, a total of 13.8%
compared to 10.2% as of December 31, 2013 and 3.8% as of December 31, 2012. This increases our strategic flexibility
by decreasing our debt to shareholders’ equity ratio, which is one determinant of borrowing capacity.
Common share repurchases As of December 31, 2014, our $2.5 billion common share repurchase program that
commenced in February 2014 had $336 million remaining and is expected to be completed in first quarter 2015. On
February 4, 2015, a new $3 billion common share repurchase program was authorized and is expected to be completed
by July 2016.
During 2014, we repurchased 39.0 million common shares for $2.31 billion. In addition to open market transactions,
we entered into two accelerated share repurchase agreements each for the purchase of $750 million of our outstanding
common stock. The first settled on July 29, 2014 and the second settled on December 18, 2014.
Since 1995, we have acquired 601 million shares of our common stock at a cost of $25.38 billion, primarily as part of
various stock repurchase programs. We have reissued 121 million common shares since 1995, primarily associated with
our equity incentive plans, the 1999 acquisition of American Heritage Life Investment Corporation and the 2001
redemption of certain mandatorily redeemable preferred securities. Since 1995, total common shares outstanding has
decreased by 480 million shares or 53.4%, primarily due to our repurchase programs.
84