Allstate 2014 Annual Report Download - page 49
Download and view the complete annual report
Please find page 49 of the 2014 Allstate annual report below. You can navigate through the pages in the report by either clicking on the pages listed below, or by using the keyword search tool below to find specific information within the annual report.-
 1
1 -
2
-
3
-
4
-
5
-
6
-
7
-
8
-
9
-
10
-
11
-
12
-
13
-
14
-
15
-
16
-
17
-
18
-
19
-
20
-
21
-
22
-
23
-
24
-
25
-
26
-
27
-
28
-
29
-
30
-
31
-
32
-
33
-
34
-
35
-
36
-
37
-
38
-
 39
39 -
 40
40 -
 41
41 -
 42
42 -
 43
43 -
 44
44 -
 45
45 -
 46
46 -
 47
47 -
 48
48 -
 49
49 -
 50
50 -
 51
51 -
 52
52 -
 53
53 -
 54
54 -
 55
55 -
 56
56 -
 57
57 -
 58
58 -
 59
59 -
60
-
61
-
62
-
63
-
64
-
65
-
66
-
67
-
68
-
69
-
70
-
71
-
72
-
73
-
74
-
75
-
76
-
77
-
78
-
79
-
80
-
81
-
82
-
83
-
84
-
85
-
86
-
87
-
88
-
89
-
90
-
91
-
92
-
93
-
94
-
95
-
96
-
97
-
98
-
99
-
100
-
101
-
102
-
103
-
104
-
105
-
106
-
107
-
108
-
109
-
110
-
111
-
112
-
113
-
114
-
115
-
116
-
117
-
118
-
119
-
120
-
121
-
122
-
123
-
124
-
125
-
126
-
127
-
128
-
129
-
130
-
131
-
132
-
133
-
134
-
135
-
136
-
137
-
138
-
139
-
140
-
141
-
142
-
143
-
144
-
145
-
146
-
147
-
148
-
149
-
150
-
151
-
152
-
153
-
154
-
155
-
156
-
157
-
158
-
159
-
160
-
161
-
162
-
163
-
164
-
165
-
166
-
167
-
168
-
169
-
170
-
171
-
172
-
173
-
174
-
175
-
176
-
177
-
178
-
179
-
180
-
181
-
182
-
183
-
184
-
185
-
186
-
187
-
188
-
189
-
190
-
191
-
192
-
193
-
194
-
195
-
196
-
197
-
198
-
199
-
200
-
201
-
202
-
203
-
204
-
205
-
206
-
207
-
208
-
209
-
210
-
211
-
212
-
213
-
214
-
215
-
216
-
217
-
218
-
219
-
220
-
221
-
222
-
223
-
224
-
225
-
226
-
227
-
228
-
229
-
230
-
231
-
232
-
233
-
234
-
235
-
236
-
237
-
238
-
239
-
240
-
241
-
242
-
243
-
244
-
245
-
246
-
247
-
248
-
249
-
250
-
251
-
252
-
253
-
254
-
255
-
256
-
257
-
258
-
259
-
260
-
261
-
262
-
263
-
264
-
265
-
266
-
267
-
268
-
269
-
270
-
271
-
272
-
273
-
274
-
275
-
276
-
277
-
278
-
279
-
280
 |
 |

9MAR201204034531
Executive Compensation — Design
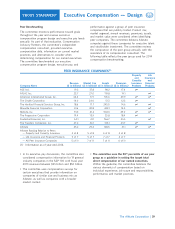
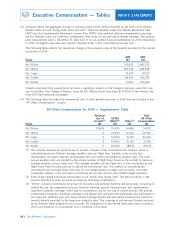
Peer Benchmarking performance against a group of peer insurance
companies that are publicly traded. Product mix,
The committee monitors performance toward goals market segment, annual revenues, premiums, assets,
throughout the year and reviews executive and market value were considered when identifying
compensation program design and executive pay levels peer companies. The committee believes Allstate
annually. As part of that evaluation, Compensation competes against these companies for executive talent
Advisory Partners, the committee’s independent and stockholder investment. The committee reviews
compensation consultant, provided executive the composition of the peer group annually with the
compensation data, information on current market assistance of its compensation consultant. The
practices, and alternatives to consider when following table reflects the peer group used for 2014
determining compensation for our named executives. compensation benchmarking.
The committee benchmarked our executive
compensation program design, executive pay, and
ACE Ltd. 19.3 37.8 98.2 17.4 ⻬
AFLAC Inc. 22.7 27.0 119.8 19.1 ⻬
American International Group, Inc. 64.4 77.1 515.6 39.9 ⻬⻬
The Chubb Corporation 14.0 24.0 51.3 12.3 ⻬
The Hartford Financial Services Group, Inc. 18.6 17.7 245.0 14.6 ⻬⻬
Manulife Financial Corporation 41.6 30.8 432.1 14.0 ⻬
MetLife, Inc. 73.3 61.2 902.3 49.0 ⻬⻬
The Progressive Corporation 19.4 15.9 25.8 18.4 ⻬
Prudential Financial, Inc. 54.1 41.1 766.7 35.5 ⻬
The Travelers Companies, Inc. 27.2 34.1 103.1 23.7 ⻬
Allstate 35.2 29.4 108.5 31.1 ⻬⻬
Allstate Ranking Relative to Peers:
— Property and Casualty Insurance 3 of 8 5 of 8 4 of 8 3 of 8
— Life Insurance and Financial Products 5 of 7 5 of 7 7 of 7 4 of 7
— All Peer Insurance Companies 5 of 11 7 of 11 7 of 11 4 of 11
(1) Information as of year-end 2014.
• In its executive pay discussions, the committee also • The committee uses the 50th percentile of our peer
considered compensation information for 19 general group as a guideline in setting the target total
industry companies in the S&P 100 with fiscal year direct compensation of our named executives.
2013 revenues between $25 billion and $50 billion. Within the guideline, the committee balances the
various elements of compensation based on
• The committee uses compensation surveys for individual experience, job scope and responsibilities,
certain executives that provide information on performance, and market practices.
companies of similar size and business mix as
Allstate, as well as companies with a broader
market context.
39
PROXY STATEMENT
PEER INSURANCE COMPANIES(1)
Property Life
and Insurance
Casualty and
Revenue Market Cap Assets Premiums Insurance Financial
Company Name ($ in billions) ($ in billions) ($ in billions) ($ in billions) Products Products
The Allstate Corporation