Allstate 2014 Annual Report Download - page 54
Download and view the complete annual report
Please find page 54 of the 2014 Allstate annual report below. You can navigate through the pages in the report by either clicking on the pages listed below, or by using the keyword search tool below to find specific information within the annual report.-
 1
1 -
2
-
3
-
4
-
5
-
6
-
7
-
8
-
9
-
10
-
11
-
12
-
13
-
14
-
15
-
16
-
17
-
18
-
19
-
20
-
21
-
22
-
23
-
24
-
25
-
26
-
27
-
28
-
29
-
30
-
31
-
32
-
33
-
34
-
35
-
36
-
37
-
38
-
39
-
40
-
41
-
42
-
43
-
 44
44 -
 45
45 -
 46
46 -
 47
47 -
 48
48 -
 49
49 -
 50
50 -
 51
51 -
 52
52 -
 53
53 -
 54
54 -
 55
55 -
 56
56 -
 57
57 -
 58
58 -
 59
59 -
 60
60 -
 61
61 -
 62
62 -
 63
63 -
 64
64 -
65
-
66
-
67
-
68
-
69
-
70
-
71
-
72
-
73
-
74
-
75
-
76
-
77
-
78
-
79
-
80
-
81
-
82
-
83
-
84
-
85
-
86
-
87
-
88
-
89
-
90
-
91
-
92
-
93
-
94
-
95
-
96
-
97
-
98
-
99
-
100
-
101
-
102
-
103
-
104
-
105
-
106
-
107
-
108
-
109
-
110
-
111
-
112
-
113
-
114
-
115
-
116
-
117
-
118
-
119
-
120
-
121
-
122
-
123
-
124
-
125
-
126
-
127
-
128
-
129
-
130
-
131
-
132
-
133
-
134
-
135
-
136
-
137
-
138
-
139
-
140
-
141
-
142
-
143
-
144
-
145
-
146
-
147
-
148
-
149
-
150
-
151
-
152
-
153
-
154
-
155
-
156
-
157
-
158
-
159
-
160
-
161
-
162
-
163
-
164
-
165
-
166
-
167
-
168
-
169
-
170
-
171
-
172
-
173
-
174
-
175
-
176
-
177
-
178
-
179
-
180
-
181
-
182
-
183
-
184
-
185
-
186
-
187
-
188
-
189
-
190
-
191
-
192
-
193
-
194
-
195
-
196
-
197
-
198
-
199
-
200
-
201
-
202
-
203
-
204
-
205
-
206
-
207
-
208
-
209
-
210
-
211
-
212
-
213
-
214
-
215
-
216
-
217
-
218
-
219
-
220
-
221
-
222
-
223
-
224
-
225
-
226
-
227
-
228
-
229
-
230
-
231
-
232
-
233
-
234
-
235
-
236
-
237
-
238
-
239
-
240
-
241
-
242
-
243
-
244
-
245
-
246
-
247
-
248
-
249
-
250
-
251
-
252
-
253
-
254
-
255
-
256
-
257
-
258
-
259
-
260
-
261
-
262
-
263
-
264
-
265
-
266
-
267
-
268
-
269
-
270
-
271
-
272
-
273
-
274
-
275
-
276
-
277
-
278
-
279
-
280
 |
 |

9MAR201204034531
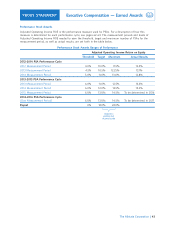
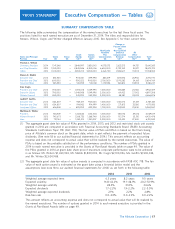
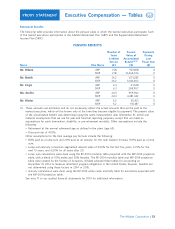
Executive Compensation — Earned Awards
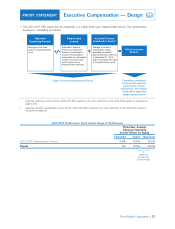
The following tables show the target number of PSAs granted to each of our named executives for the 2012-2014,
2013-2015, and 2014-2016 performance cycles, and the number of PSAs earned based on achievement of the
performance measure.
2012 Measurement Period 2013 Measurement Period 2014 Measurement Period
Mr. Wilson 124,194 41,398 82,796 41,398 82,796 41,398 78,656
Mr. Shebik 9,736 3,245 6,490 3,245 6,490 3,246 6,167
Mr. Civgin 30,645 10,215 20,430 10,215 20,430 10,215 19,409
Ms. Greffin 29,032 9,677 19,354 9,677 19,354 9,678 18,388
Mr. Winter 40,323 13,441 26,882 13,441 26,882 13,441 25,538
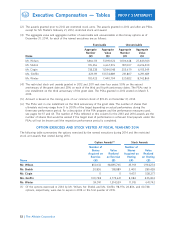
(1) The actual number of PSAs to be earned for each measurement period varies from 0% to 200% of the
target PSAs based on Adjusted Operating Income ROE for such measurement period.
(2) For the 2012 and 2013 measurement periods, the named executives earned PSAs equal to the maximum, or
200%, of the target number for that measurement period. For the 2014 measurement period, the named
executives earned PSAs equal to 190% of the target number for that measurement period.
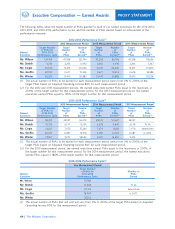
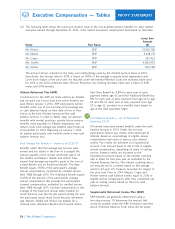
2013 Measurement Period 2014 Measurement Period 2015 Measurement Period
Mr. Wilson 84,411 28,137 56,274 28,137 50,647 28,137
Mr. Shebik 19,733 6,577 13,154 6,578 11,840 6,578 To be
Mr. Civgin 23,021 7,673 15,346 7,674 13,813 7,674 determined
Ms. Greffin 20,061 6,687 13,374 6,687 12,037 6,687 in 2016.
Mr. Winter 27,817 9,272 18,544 9,272 16,690 9,273
(1) The actual number of PSAs to be earned for each measurement period varies from 0% to 200% of the
target PSAs based on Adjusted Operating Income ROE for such measurement period.
(2) For the 2013 measurement period, the named executives earned PSAs equal to the maximum, or 200%, of
the target number for that measurement period. For the 2014 measurement period, the named executives
earned PSAs equal to 180% of the target number for that measurement period.
One Measurement Period
Mr. Wilson 73,783
17,248 To be
Mr. Shebik
20,123 determined
Mr. Civgin
18,494 in 2017.
Ms. Greffin
25,153
Mr. Winter
(1) The actual number of PSAs that will vest will vary from 0% to 200% of the target PSAs based on Adjusted
Operating Income ROE for the measurement period.
44
PROXY STATEMENT
2012-2014 Performance Cycle(1)
Target Number Target Number Target Number Target Number
of PSAs for Number of Number of Number of
Named 2012-2014 of PSAs of PSAs of PSAs
Executive Performance Cycle PSAs Earned(2) PSAs Earned(2) PSAs Earned(2)
2013-2015 Performance Cycle(1)
Target Number Target Number Target Number Target Number
of PSAs for Number of Number of Number of
Named 2013-2015 of PSAs of PSAs of PSAs
Executive Performance Cycle PSAs Earned(2) PSAs Earned(2) PSAs Earned(2)
2014-2016 Performance Cycle(1)
Target Number
of PSAs for Number of
Named 2014-2016 PSAs
Executive Performance Cycle Earned
The Allstate Corporation