Allstate 2014 Annual Report Download - page 53
Download and view the complete annual report
Please find page 53 of the 2014 Allstate annual report below. You can navigate through the pages in the report by either clicking on the pages listed below, or by using the keyword search tool below to find specific information within the annual report.-
 1
1 -
2
-
3
-
4
-
5
-
6
-
7
-
8
-
9
-
10
-
11
-
12
-
13
-
14
-
15
-
16
-
17
-
18
-
19
-
20
-
21
-
22
-
23
-
24
-
25
-
26
-
27
-
28
-
29
-
30
-
31
-
32
-
33
-
34
-
35
-
36
-
37
-
38
-
39
-
40
-
41
-
42
-
 43
43 -
 44
44 -
 45
45 -
 46
46 -
 47
47 -
 48
48 -
 49
49 -
 50
50 -
 51
51 -
 52
52 -
 53
53 -
 54
54 -
 55
55 -
 56
56 -
 57
57 -
 58
58 -
 59
59 -
 60
60 -
 61
61 -
 62
62 -
 63
63 -
64
-
65
-
66
-
67
-
68
-
69
-
70
-
71
-
72
-
73
-
74
-
75
-
76
-
77
-
78
-
79
-
80
-
81
-
82
-
83
-
84
-
85
-
86
-
87
-
88
-
89
-
90
-
91
-
92
-
93
-
94
-
95
-
96
-
97
-
98
-
99
-
100
-
101
-
102
-
103
-
104
-
105
-
106
-
107
-
108
-
109
-
110
-
111
-
112
-
113
-
114
-
115
-
116
-
117
-
118
-
119
-
120
-
121
-
122
-
123
-
124
-
125
-
126
-
127
-
128
-
129
-
130
-
131
-
132
-
133
-
134
-
135
-
136
-
137
-
138
-
139
-
140
-
141
-
142
-
143
-
144
-
145
-
146
-
147
-
148
-
149
-
150
-
151
-
152
-
153
-
154
-
155
-
156
-
157
-
158
-
159
-
160
-
161
-
162
-
163
-
164
-
165
-
166
-
167
-
168
-
169
-
170
-
171
-
172
-
173
-
174
-
175
-
176
-
177
-
178
-
179
-
180
-
181
-
182
-
183
-
184
-
185
-
186
-
187
-
188
-
189
-
190
-
191
-
192
-
193
-
194
-
195
-
196
-
197
-
198
-
199
-
200
-
201
-
202
-
203
-
204
-
205
-
206
-
207
-
208
-
209
-
210
-
211
-
212
-
213
-
214
-
215
-
216
-
217
-
218
-
219
-
220
-
221
-
222
-
223
-
224
-
225
-
226
-
227
-
228
-
229
-
230
-
231
-
232
-
233
-
234
-
235
-
236
-
237
-
238
-
239
-
240
-
241
-
242
-
243
-
244
-
245
-
246
-
247
-
248
-
249
-
250
-
251
-
252
-
253
-
254
-
255
-
256
-
257
-
258
-
259
-
260
-
261
-
262
-
263
-
264
-
265
-
266
-
267
-
268
-
269
-
270
-
271
-
272
-
273
-
274
-
275
-
276
-
277
-
278
-
279
-
280
 |
 |

9MAR201204034531
15MAR201517143126
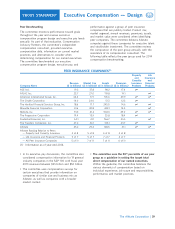
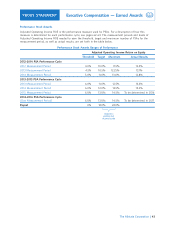
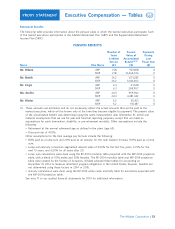
Executive Compensation — Earned Awards
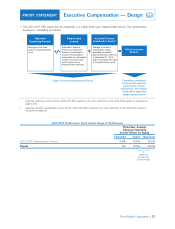
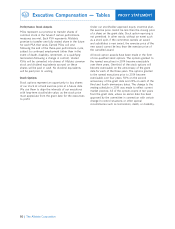
Performance Stock Awards
Adjusted Operating Income ROE is the performance measure used for PSAs. For a description of how this
measure is determined for each performance cycle, see pages 62-63. The measurement periods and levels of
Adjusted Operating Income ROE needed to earn the threshold, target and maximum number of PSAs for the
measurement period, as well as actual results, are set forth in the table below.
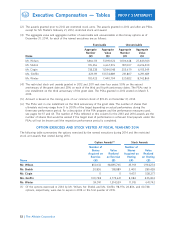
Adjusted Operating Income Return on Equity
2012-2014 PSA Performance Cycle
4.0% 10.0% 11.5% 12.3%
4.5% 10.5% 12.25% 13.1%
5.0% 11.0% 13.0% 12.8%
2013-2015 PSA Performance Cycle
6.0% 11.0% 12.5% 13.4%
6.0% 12.0% 13.5% 13.2%
6.0% 13.0% 14.5% To be determined in 2016
2014-2016 PSA Performance Cycle
6.0% 13.0% 14.5% To be determined in 2017
Payout 0% 100% 200%
Subject to
positive net
income hurdle
43
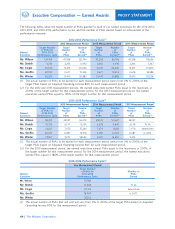
PROXY STATEMENT
Performance Stock Awards Ranges of Performance
Threshold Target Maximum Actual Results
2012 Measurement Period
2013 Measurement Period
2014 Measurement Period
2013 Measurement Period
2014 Measurement Period
2015 Measurement Period
(One Measurement Period)
The Allstate Corporation