Allstate 2014 Annual Report Download - page 180
Download and view the complete annual report
Please find page 180 of the 2014 Allstate annual report below. You can navigate through the pages in the report by either clicking on the pages listed below, or by using the keyword search tool below to find specific information within the annual report.-
 1
1 -
2
-
3
-
4
-
5
-
6
-
7
-
8
-
9
-
10
-
11
-
12
-
13
-
14
-
15
-
16
-
17
-
18
-
19
-
20
-
21
-
22
-
23
-
24
-
25
-
26
-
27
-
28
-
29
-
30
-
31
-
32
-
33
-
34
-
35
-
36
-
37
-
38
-
39
-
40
-
41
-
42
-
43
-
44
-
45
-
46
-
47
-
48
-
49
-
50
-
51
-
52
-
53
-
54
-
55
-
56
-
57
-
58
-
59
-
60
-
61
-
62
-
63
-
64
-
65
-
66
-
67
-
68
-
69
-
70
-
71
-
72
-
73
-
74
-
75
-
76
-
77
-
78
-
79
-
80
-
81
-
82
-
83
-
84
-
85
-
86
-
87
-
88
-
89
-
90
-
91
-
92
-
93
-
94
-
95
-
96
-
97
-
98
-
99
-
100
-
101
-
102
-
103
-
104
-
105
-
106
-
107
-
108
-
109
-
110
-
111
-
112
-
113
-
114
-
115
-
116
-
117
-
118
-
119
-
120
-
121
-
122
-
123
-
124
-
125
-
126
-
127
-
128
-
129
-
130
-
131
-
132
-
133
-
134
-
135
-
136
-
137
-
138
-
139
-
140
-
141
-
142
-
143
-
144
-
145
-
146
-
147
-
148
-
149
-
150
-
151
-
152
-
153
-
154
-
155
-
156
-
157
-
158
-
159
-
160
-
161
-
162
-
163
-
164
-
165
-
166
-
167
-
168
-
169
-
 170
170 -
 171
171 -
 172
172 -
 173
173 -
 174
174 -
 175
175 -
 176
176 -
 177
177 -
 178
178 -
 179
179 -
 180
180 -
 181
181 -
 182
182 -
 183
183 -
 184
184 -
 185
185 -
 186
186 -
 187
187 -
 188
188 -
 189
189 -
 190
190 -
191
-
192
-
193
-
194
-
195
-
196
-
197
-
198
-
199
-
200
-
201
-
202
-
203
-
204
-
205
-
206
-
207
-
208
-
209
-
210
-
211
-
212
-
213
-
214
-
215
-
216
-
217
-
218
-
219
-
220
-
221
-
222
-
223
-
224
-
225
-
226
-
227
-
228
-
229
-
230
-
231
-
232
-
233
-
234
-
235
-
236
-
237
-
238
-
239
-
240
-
241
-
242
-
243
-
244
-
245
-
246
-
247
-
248
-
249
-
250
-
251
-
252
-
253
-
254
-
255
-
256
-
257
-
258
-
259
-
260
-
261
-
262
-
263
-
264
-
265
-
266
-
267
-
268
-
269
-
270
-
271
-
272
-
273
-
274
-
275
-
276
-
277
-
278
-
279
-
280
 |
 |

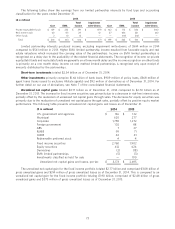
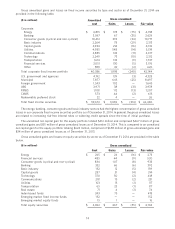
As of December 31, 2014, we had $1.35 billion in foreign currency denominated equity investments, $843 million
net investment in our foreign subsidiaries, primarily related to our Canadian operations, and $283 million in unhedged
non-dollar pay fixed income securities. These amounts were $1.10 billion, $878 million, and $330 million, respectively,
as of December 31, 2013. 68.0% of the foreign currency exposure is in the Property-Liability business.
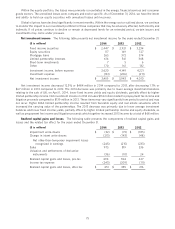
Based upon the information and assumptions used as of December 31, 2014, we estimate that a 10% immediate
unfavorable change in each of the foreign currency exchange rates to which we are exposed would decrease the value of
our foreign currency denominated instruments by $235 million, compared with an estimated $254 million decrease as
of December 31, 2013. The selection of a 10% immediate decrease in all currency exchange rates should not be
construed as our prediction of future market events, but only as an illustration of the potential effect of such an event.
The modeling technique we use to report our currency exposure does not take into account correlation among
foreign currency exchange rates. Even though we believe it is very unlikely that all of the foreign currency exchange rates
that we are exposed to would simultaneously decrease by 10%, we nonetheless stress test our portfolio under this and
other hypothetical extreme adverse market scenarios. Our actual experience may differ from these results because of
assumptions we have used or because significant liquidity and market events could occur that we did not foresee.
PENSION PLANS
We have defined benefit pension plans, which cover most full-time, certain part-time employees and employee-
agents. Benefits are based primarily on a cash balance formula, however certain participants have a significant portion
of their benefits attributable to a former final average pay formula. 91% of the projected benefit obligation of our primary
qualified employee plan is related to the former final average pay formula. See Note 17 of the consolidated financial
statements for a complete discussion of these plans and their effect on the consolidated financial statements. The
pension and other postretirement plans may be amended or terminated at any time. Any revisions could result in
significant changes to our obligations and our obligation to fund the plans.
We report unrecognized pension and other postretirement benefit cost in the Consolidated Statements of Financial
Position as a component of accumulated other comprehensive income in shareholders’ equity. It represents the after-tax
differences between the fair value of plan assets and the projected benefit obligation (‘‘PBO’’) for pension plans and the
accumulated postretirement benefit obligation for other postretirement plans that have not yet been recognized as a
component of net periodic cost. As of December 31, 2014, unrecognized pension and other postretirement benefit cost
totaled $1.36 billion comprising $1.49 billion related to pension benefits and $(122) million related to other
postretirement benefits. The unrecognized pension and other postretirement benefit cost increased by $725 million as
of December 31, 2014 from $638 million as of December 31, 2013. The measurement of the unrecognized pension and
other postretirement benefit cost can vary based upon the fluctuations in the fair value of plan assets and the actuarial
assumptions used for the plans as discussed below. The increase in the unrecognized pension and other postretirement
benefit cost primarily related to actuarial assumption and census data updates, including decreases in the discount rate
assumptions, the adoption of new Society of Actuaries mortality assumptions and lump sum payments at discount rates
lower than actuarial assumptions.
During 2014, we offered certain vested terminated employees the opportunity to receive lump sum payments. As a
result, $75 million of benefit payments resulted in a reduction of the pension benefit obligation of approximately
$90 million.
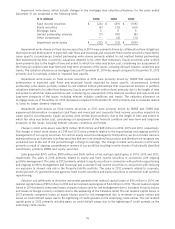
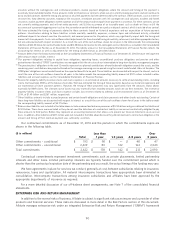
The components of net periodic pension cost for all pension plans for the years ended December 31 are as follows:
($ in millions) 2014 2013 2012
Service cost $ 96 $ 140 $ 152
Interest cost 262 265 298
Expected return on plan assets (398) (394) (393)
Amortization of:
Prior service credit (58) (28) (2)
Net actuarial loss 127 235 178
Settlement loss 54 277 33
Net periodic cost $ 83 $ 495 $ 266
The service cost component is the actuarial present value of the benefits attributed by the plans benefit formula to
services rendered by the employees during the period. Interest cost is the increase in the PBO in the period due to the
passage of time at the discount rate. Interest cost fluctuates as the discount rate changes and is also impacted by the
related change in the size of the PBO. The decrease or increase in the PBO due to an increase or decrease in the discount
rate is deferred and decreases or increases the net actuarial loss. It is recorded in accumulated other comprehensive
income as unrecognized pension benefit cost and may be amortized.
80