Allstate 2014 Annual Report Download - page 267
Download and view the complete annual report
Please find page 267 of the 2014 Allstate annual report below. You can navigate through the pages in the report by either clicking on the pages listed below, or by using the keyword search tool below to find specific information within the annual report.-
 1
1 -
2
-
3
-
4
-
5
-
6
-
7
-
8
-
9
-
10
-
11
-
12
-
13
-
14
-
15
-
16
-
17
-
18
-
19
-
20
-
21
-
22
-
23
-
24
-
25
-
26
-
27
-
28
-
29
-
30
-
31
-
32
-
33
-
34
-
35
-
36
-
37
-
38
-
39
-
40
-
41
-
42
-
43
-
44
-
45
-
46
-
47
-
48
-
49
-
50
-
51
-
52
-
53
-
54
-
55
-
56
-
57
-
58
-
59
-
60
-
61
-
62
-
63
-
64
-
65
-
66
-
67
-
68
-
69
-
70
-
71
-
72
-
73
-
74
-
75
-
76
-
77
-
78
-
79
-
80
-
81
-
82
-
83
-
84
-
85
-
86
-
87
-
88
-
89
-
90
-
91
-
92
-
93
-
94
-
95
-
96
-
97
-
98
-
99
-
100
-
101
-
102
-
103
-
104
-
105
-
106
-
107
-
108
-
109
-
110
-
111
-
112
-
113
-
114
-
115
-
116
-
117
-
118
-
119
-
120
-
121
-
122
-
123
-
124
-
125
-
126
-
127
-
128
-
129
-
130
-
131
-
132
-
133
-
134
-
135
-
136
-
137
-
138
-
139
-
140
-
141
-
142
-
143
-
144
-
145
-
146
-
147
-
148
-
149
-
150
-
151
-
152
-
153
-
154
-
155
-
156
-
157
-
158
-
159
-
160
-
161
-
162
-
163
-
164
-
165
-
166
-
167
-
168
-
169
-
170
-
171
-
172
-
173
-
174
-
175
-
176
-
177
-
178
-
179
-
180
-
181
-
182
-
183
-
184
-
185
-
186
-
187
-
188
-
189
-
190
-
191
-
192
-
193
-
194
-
195
-
196
-
197
-
198
-
199
-
200
-
201
-
202
-
203
-
204
-
205
-
206
-
207
-
208
-
209
-
210
-
211
-
212
-
213
-
214
-
215
-
216
-
217
-
218
-
219
-
220
-
221
-
222
-
223
-
224
-
225
-
226
-
227
-
228
-
229
-
230
-
231
-
232
-
233
-
234
-
235
-
236
-
237
-
238
-
239
-
240
-
241
-
242
-
243
-
244
-
245
-
246
-
247
-
248
-
249
-
250
-
251
-
252
-
253
-
254
-
255
-
256
-
 257
257 -
 258
258 -
 259
259 -
 260
260 -
 261
261 -
 262
262 -
 263
263 -
 264
264 -
 265
265 -
 266
266 -
 267
267 -
 268
268 -
 269
269 -
 270
270 -
 271
271 -
 272
272 -
 273
273 -
 274
274 -
 275
275 -
 276
276 -
 277
277 -
278
-
279
-
280
 |
 |

(2) Private equity funds held by the pension plans are primarily comprised of North American buyout funds.
(3) The securities lending obligation represents the plan’s obligation to return securities lending collateral received under a
securities lending program. The terms of the program allow both the plan and the counterparty the right and ability to
redeem/return the securities loaned on short notice. Due to its relatively short-term nature, the outstanding balance of the
obligation approximates fair value.
(4) Other net plan assets represent interest and dividends receivable and net receivables related to settlements of investment
transactions, such as purchases and sales.
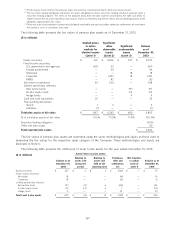
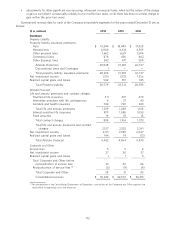
The following table presents the fair values of pension plan assets as of December 31, 2013.
($ in millions)
Quoted prices Significant
in active other Significant Balance
markets for observable unobservable as of
identical assets inputs inputs December 31,
(Level 1) (Level 2) (Level 3) 2013
Equity securities $ 160 $ 2,306 $ 237 $ 2,703
Fixed income securities:
U.S. government and agencies 608 52 — 660
Foreign government — 44 — 44
Municipal — — 18 18
Corporate — 1,433 18 1,451
RMBS — 83 — 83
Short-term investments 54 344 — 398
Limited partnership interests:
Real estate funds — — 197 197
Private equity funds — — 211 211
Hedge funds — — 9 9
Cash and cash equivalents 25 — — 25
Free-standing derivatives:
Assets 1 3 — 4
Liabilities (1) — — (1)
Total plan assets at fair value $ 847 $ 4,265 $ 690 5,802
% of total plan assets at fair value 14.6% 73.5% 11.9% 100.0%
Securities lending obligation (290)
Other net plan assets 90
Total reported plan assets $ 5,602
The fair values of pension plan assets are estimated using the same methodologies and inputs as those used to
determine the fair values for the respective asset category of the Company. These methodologies and inputs are
disclosed in Note 6.
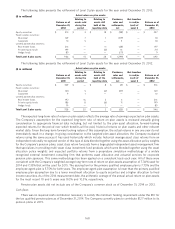
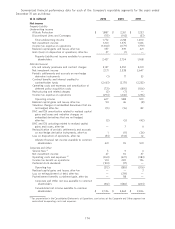
The following table presents the rollforward of Level 3 plan assets for the year ended December 31, 2014.
Actual return on plan assets:
($ in millions)
Relating to Relating to Purchases, Net transfers
Balance as of assets sold assets still sales and in and/or Balance as of
December 31, during the held at the settlements, (out) of December 31,
2013 period reporting date net Level 3 2014
Equity securities $ 237 $ 2 $ 2 $ (166) $ — $ 75
Fixed income securities:
Municipal 18 — — (4) — 14
Corporate 18 — — (6) — 12
Limited partnership interests:
Real estate funds 197 (3) 6 (46) — 154
Private equity funds 211 (4) 4 7 — 218
Hedge funds 9 — — 23 — 32
Total Level 3 plan assets $ 690 $ (5) $ 12 $ (192) $ — $ 505
167