Allstate 2014 Annual Report Download - page 216
Download and view the complete annual report
Please find page 216 of the 2014 Allstate annual report below. You can navigate through the pages in the report by either clicking on the pages listed below, or by using the keyword search tool below to find specific information within the annual report.-
 1
1 -
2
-
3
-
4
-
5
-
6
-
7
-
8
-
9
-
10
-
11
-
12
-
13
-
14
-
15
-
16
-
17
-
18
-
19
-
20
-
21
-
22
-
23
-
24
-
25
-
26
-
27
-
28
-
29
-
30
-
31
-
32
-
33
-
34
-
35
-
36
-
37
-
38
-
39
-
40
-
41
-
42
-
43
-
44
-
45
-
46
-
47
-
48
-
49
-
50
-
51
-
52
-
53
-
54
-
55
-
56
-
57
-
58
-
59
-
60
-
61
-
62
-
63
-
64
-
65
-
66
-
67
-
68
-
69
-
70
-
71
-
72
-
73
-
74
-
75
-
76
-
77
-
78
-
79
-
80
-
81
-
82
-
83
-
84
-
85
-
86
-
87
-
88
-
89
-
90
-
91
-
92
-
93
-
94
-
95
-
96
-
97
-
98
-
99
-
100
-
101
-
102
-
103
-
104
-
105
-
106
-
107
-
108
-
109
-
110
-
111
-
112
-
113
-
114
-
115
-
116
-
117
-
118
-
119
-
120
-
121
-
122
-
123
-
124
-
125
-
126
-
127
-
128
-
129
-
130
-
131
-
132
-
133
-
134
-
135
-
136
-
137
-
138
-
139
-
140
-
141
-
142
-
143
-
144
-
145
-
146
-
147
-
148
-
149
-
150
-
151
-
152
-
153
-
154
-
155
-
156
-
157
-
158
-
159
-
160
-
161
-
162
-
163
-
164
-
165
-
166
-
167
-
168
-
169
-
170
-
171
-
172
-
173
-
174
-
175
-
176
-
177
-
178
-
179
-
180
-
181
-
182
-
183
-
184
-
185
-
186
-
187
-
188
-
189
-
190
-
191
-
192
-
193
-
194
-
195
-
196
-
197
-
198
-
199
-
200
-
201
-
202
-
203
-
204
-
205
-
 206
206 -
 207
207 -
 208
208 -
 209
209 -
 210
210 -
 211
211 -
 212
212 -
 213
213 -
 214
214 -
 215
215 -
 216
216 -
 217
217 -
 218
218 -
 219
219 -
 220
220 -
 221
221 -
 222
222 -
 223
223 -
 224
224 -
 225
225 -
 226
226 -
227
-
228
-
229
-
230
-
231
-
232
-
233
-
234
-
235
-
236
-
237
-
238
-
239
-
240
-
241
-
242
-
243
-
244
-
245
-
246
-
247
-
248
-
249
-
250
-
251
-
252
-
253
-
254
-
255
-
256
-
257
-
258
-
259
-
260
-
261
-
262
-
263
-
264
-
265
-
266
-
267
-
268
-
269
-
270
-
271
-
272
-
273
-
274
-
275
-
276
-
277
-
278
-
279
-
280
 |
 |

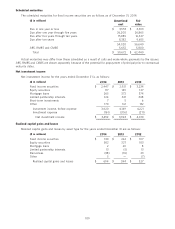
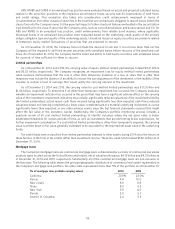
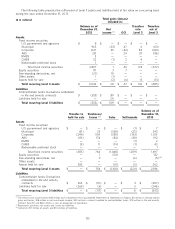
The types of properties collateralizing the mortgage loans as of December 31 are as follows:
(% of mortgage loan portfolio carrying value) 2014 2013
Office buildings 24.3% 26.5%
Apartment complex 23.3 23.2
Retail 22.2 21.0
Warehouse 17.8 18.0
Other 12.4 11.3
Total 100.0% 100.0%
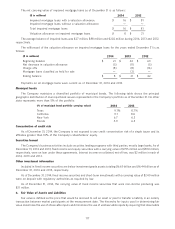
The contractual maturities of the mortgage loan portfolio as of December 31, 2014 are as follows:
($ in millions) Number of Carrying
loans value Percent
2015 21 $ 249 5.9%
2016 37 398 9.5
2017 37 419 10.0
2018 36 459 11.0
Thereafter 190 2,663 63.6
Total 321 $ 4,188 100.0%
Mortgage loans are evaluated for impairment on a specific loan basis through a quarterly credit monitoring process
and review of key credit quality indicators. Mortgage loans are considered impaired when it is probable that the
Company will not collect the contractual principal and interest. Valuation allowances are established for impaired loans
to reduce the carrying value to the fair value of the collateral less costs to sell or the present value of the loan’s expected
future repayment cash flows discounted at the loan’s original effective interest rate. Impaired mortgage loans may not
have a valuation allowance when the fair value of the collateral less costs to sell is higher than the carrying value.
Valuation allowances are adjusted for subsequent changes in the fair value of the collateral less costs to sell. Mortgage
loans are charged off against their corresponding valuation allowances when there is no reasonable expectation of
recovery. The impairment evaluation is non-statistical in respect to the aggregate portfolio but considers facts and
circumstances attributable to each loan. It is not considered probable that additional impairment losses, beyond those
identified on a specific loan basis, have been incurred as of December 31, 2014.
Accrual of income is suspended for mortgage loans that are in default or when full and timely collection of principal
and interest payments is not probable. Cash receipts on mortgage loans on nonaccrual status are generally recorded as
a reduction of carrying value.
Debt service coverage ratio is considered a key credit quality indicator when mortgage loans are evaluated for
impairment. Debt service coverage ratio represents the amount of estimated cash flows from the property available to
the borrower to meet principal and interest payment obligations. Debt service coverage ratio estimates are updated
annually or more frequently if conditions are warranted based on the Company’s credit monitoring process.
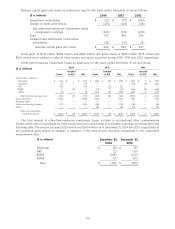
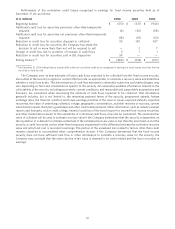
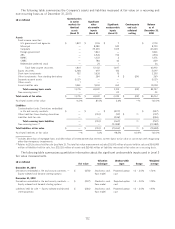
The following table reflects the carrying value of non-impaired fixed rate and variable rate mortgage loans
summarized by debt service coverage ratio distribution as of December 31:
2014 2013
($ in millions)
Fixed rate Variable rate Fixed rate Variable rate
mortgage mortgage mortgage mortgage
Debt service coverage ratio loans loans Total loans loans Total
distribution
Below 1.0 $ 110 $ — $ 110 $ 153 $ — $ 153
1.0 - 1.25 424 — 424 613 — 613
1.26 - 1.50 1,167 1 1,168 1,233 2 1,235
Above 1.50 2,450 20 2,470 2,562 77 2,639
Total non-impaired mortgage loans $ 4,151 $ 21 $ 4,172 $ 4,561 $ 79 $ 4,640
Mortgage loans with a debt service coverage ratio below 1.0 that are not considered impaired primarily relate to
instances where the borrower has the financial capacity to fund the revenue shortfalls from the properties for the
foreseeable term, the decrease in cash flows from the properties is considered temporary, or there are other risk
mitigating circumstances such as additional collateral, escrow balances or borrower guarantees.
116