Allstate 2014 Annual Report Download - page 188
Download and view the complete annual report
Please find page 188 of the 2014 Allstate annual report below. You can navigate through the pages in the report by either clicking on the pages listed below, or by using the keyword search tool below to find specific information within the annual report.-
 1
1 -
2
-
3
-
4
-
5
-
6
-
7
-
8
-
9
-
10
-
11
-
12
-
13
-
14
-
15
-
16
-
17
-
18
-
19
-
20
-
21
-
22
-
23
-
24
-
25
-
26
-
27
-
28
-
29
-
30
-
31
-
32
-
33
-
34
-
35
-
36
-
37
-
38
-
39
-
40
-
41
-
42
-
43
-
44
-
45
-
46
-
47
-
48
-
49
-
50
-
51
-
52
-
53
-
54
-
55
-
56
-
57
-
58
-
59
-
60
-
61
-
62
-
63
-
64
-
65
-
66
-
67
-
68
-
69
-
70
-
71
-
72
-
73
-
74
-
75
-
76
-
77
-
78
-
79
-
80
-
81
-
82
-
83
-
84
-
85
-
86
-
87
-
88
-
89
-
90
-
91
-
92
-
93
-
94
-
95
-
96
-
97
-
98
-
99
-
100
-
101
-
102
-
103
-
104
-
105
-
106
-
107
-
108
-
109
-
110
-
111
-
112
-
113
-
114
-
115
-
116
-
117
-
118
-
119
-
120
-
121
-
122
-
123
-
124
-
125
-
126
-
127
-
128
-
129
-
130
-
131
-
132
-
133
-
134
-
135
-
136
-
137
-
138
-
139
-
140
-
141
-
142
-
143
-
144
-
145
-
146
-
147
-
148
-
149
-
150
-
151
-
152
-
153
-
154
-
155
-
156
-
157
-
158
-
159
-
160
-
161
-
162
-
163
-
164
-
165
-
166
-
167
-
168
-
169
-
170
-
171
-
172
-
173
-
174
-
175
-
176
-
177
-
 178
178 -
 179
179 -
 180
180 -
 181
181 -
 182
182 -
 183
183 -
 184
184 -
 185
185 -
 186
186 -
 187
187 -
 188
188 -
 189
189 -
 190
190 -
 191
191 -
 192
192 -
 193
193 -
 194
194 -
 195
195 -
 196
196 -
 197
197 -
 198
198 -
199
-
200
-
201
-
202
-
203
-
204
-
205
-
206
-
207
-
208
-
209
-
210
-
211
-
212
-
213
-
214
-
215
-
216
-
217
-
218
-
219
-
220
-
221
-
222
-
223
-
224
-
225
-
226
-
227
-
228
-
229
-
230
-
231
-
232
-
233
-
234
-
235
-
236
-
237
-
238
-
239
-
240
-
241
-
242
-
243
-
244
-
245
-
246
-
247
-
248
-
249
-
250
-
251
-
252
-
253
-
254
-
255
-
256
-
257
-
258
-
259
-
260
-
261
-
262
-
263
-
264
-
265
-
266
-
267
-
268
-
269
-
270
-
271
-
272
-
273
-
274
-
275
-
276
-
277
-
278
-
279
-
280
 |
 |

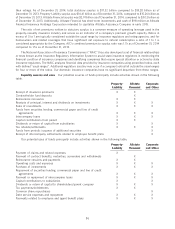
Liquidity exposure Contractholder funds were $22.53 billion as of December 31, 2014. The following table
summarizes contractholder funds by their contractual withdrawal provisions as of December 31, 2014.
($ in millions) Percent
to total
Not subject to discretionary withdrawal $ 3,653 16.2%
Subject to discretionary withdrawal with adjustments:
Specified surrender charges (1) 6,244 27.7
Market value adjustments (2) 2,348 10.4
Subject to discretionary withdrawal without adjustments (3) 10,284 45.7
Total contractholder funds (4) $ 22,529 100.0%
(1) Includes $2.53 billion of liabilities with a contractual surrender charge of less than 5% of the account balance.
(2) $1.67 billion of the contracts with market value adjusted surrenders have a 30-45 day period at the end of their initial
and subsequent interest rate guarantee periods (which are typically 5, 7 or 10 years) during which there is no
surrender charge or market value adjustment.
(3) 86% of these contracts have a minimum interest crediting rate guarantee of 3% or higher.
(4) Includes $844 million of contractholder funds on variable annuities reinsured to The Prudential Insurance Company of
America, a subsidiary of Prudential Financial Inc., in 2006.
Retail life and annuity products may be surrendered by customers for a variety of reasons. Reasons unique to
individual customers include a current or unexpected need for cash or a change in life insurance coverage needs. Other
key factors that may impact the likelihood of customer surrender include the level of the contract surrender charge, the
length of time the contract has been in force, distribution channel, market interest rates, equity market conditions and
potential tax implications. In addition, the propensity for retail life insurance policies to lapse is lower than it is for fixed
annuities because of the need for the insured to be re-underwritten upon policy replacement. The surrender and partial
withdrawal rate on deferred fixed annuities and interest-sensitive life insurance products, based on the beginning of year
contractholder funds, was 9.9% and 10.2% in 2014 and 2013, respectively. Allstate Financial strives to promptly pay
customers who request cash surrenders; however, statutory regulations generally provide up to six months in most
states to fulfill surrender requests.
Our asset-liability management practices enable us to manage the differences between the cash flows generated by
our investment portfolio and the expected cash flow requirements of our life insurance and annuity product obligations.
Certain remote events and circumstances could constrain our liquidity. Those events and circumstances include, for
example, a catastrophe resulting in extraordinary losses, a downgrade in our senior long-term debt rating of A3, A- and
a- (from Moody’s, S&P and A.M. Best, respectively) to non-investment grade status of below Baa3/BBB-/bb, a
downgrade in AIC’s financial strength rating from Aa3, AA- and A+ (from Moody’s, S&P and A.M. Best, respectively) to
below Baa2/BBB/A-, or a downgrade in ALIC’s financial strength ratings from A1, A+ and A+ (from Moody’s, S&P
and A.M. Best, respectively) to below A3/A-/A-. The rating agencies also consider the interdependence of our
individually rated entities; therefore, a rating change in one entity could potentially affect the ratings of other related
entities.
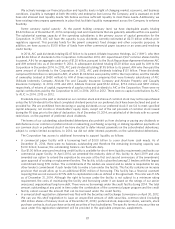
The following table summarizes consolidated cash flow activities by segment.
Property-Liability (1) Allstate Financial (1) Corporate and Other (1) Consolidated
($ in millions)
2014 2013 2012 2014 2013 2012 2014 2013 2012 2014 2013 2012
Net cash provided
by (used in):
Operating activities $ 2,765 $ 3,058 $ 2,023 $ 720 $ 1,068 $ 1,165 $ (249) $ 116 $ (134) $ 3,236 $ 4,242 $ 3,054
Investing activities 99 (1,858) (1,081) 2,315 3,833 2,497 (793) (395) 165 1,621 1,580 1,581
Financing activities (3) 38 (18) (2,274) (4,393) (3,363) (2,598) (1,598) (1,224) (4,875) (5,953) (4,605)
Net (decrease)
increase in
consolidated
cash $ (18) $ (131) $ 30
(1) Business unit cash flows reflect the elimination of intersegment dividends, contributions and borrowings.
Property-Liability Lower cash provided by operating activities in 2014 compared to 2013 was primarily due to
higher claim payments, the proceeds received in 2013 from the surrender of company owned life insurance and higher
88