Allstate 2014 Annual Report Download - page 208
Download and view the complete annual report
Please find page 208 of the 2014 Allstate annual report below. You can navigate through the pages in the report by either clicking on the pages listed below, or by using the keyword search tool below to find specific information within the annual report.-
 1
1 -
2
-
3
-
4
-
5
-
6
-
7
-
8
-
9
-
10
-
11
-
12
-
13
-
14
-
15
-
16
-
17
-
18
-
19
-
20
-
21
-
22
-
23
-
24
-
25
-
26
-
27
-
28
-
29
-
30
-
31
-
32
-
33
-
34
-
35
-
36
-
37
-
38
-
39
-
40
-
41
-
42
-
43
-
44
-
45
-
46
-
47
-
48
-
49
-
50
-
51
-
52
-
53
-
54
-
55
-
56
-
57
-
58
-
59
-
60
-
61
-
62
-
63
-
64
-
65
-
66
-
67
-
68
-
69
-
70
-
71
-
72
-
73
-
74
-
75
-
76
-
77
-
78
-
79
-
80
-
81
-
82
-
83
-
84
-
85
-
86
-
87
-
88
-
89
-
90
-
91
-
92
-
93
-
94
-
95
-
96
-
97
-
98
-
99
-
100
-
101
-
102
-
103
-
104
-
105
-
106
-
107
-
108
-
109
-
110
-
111
-
112
-
113
-
114
-
115
-
116
-
117
-
118
-
119
-
120
-
121
-
122
-
123
-
124
-
125
-
126
-
127
-
128
-
129
-
130
-
131
-
132
-
133
-
134
-
135
-
136
-
137
-
138
-
139
-
140
-
141
-
142
-
143
-
144
-
145
-
146
-
147
-
148
-
149
-
150
-
151
-
152
-
153
-
154
-
155
-
156
-
157
-
158
-
159
-
160
-
161
-
162
-
163
-
164
-
165
-
166
-
167
-
168
-
169
-
170
-
171
-
172
-
173
-
174
-
175
-
176
-
177
-
178
-
179
-
180
-
181
-
182
-
183
-
184
-
185
-
186
-
187
-
188
-
189
-
190
-
191
-
192
-
193
-
194
-
195
-
196
-
197
-
 198
198 -
 199
199 -
 200
200 -
 201
201 -
 202
202 -
 203
203 -
 204
204 -
 205
205 -
 206
206 -
 207
207 -
 208
208 -
 209
209 -
 210
210 -
 211
211 -
 212
212 -
 213
213 -
 214
214 -
 215
215 -
 216
216 -
 217
217 -
 218
218 -
219
-
220
-
221
-
222
-
223
-
224
-
225
-
226
-
227
-
228
-
229
-
230
-
231
-
232
-
233
-
234
-
235
-
236
-
237
-
238
-
239
-
240
-
241
-
242
-
243
-
244
-
245
-
246
-
247
-
248
-
249
-
250
-
251
-
252
-
253
-
254
-
255
-
256
-
257
-
258
-
259
-
260
-
261
-
262
-
263
-
264
-
265
-
266
-
267
-
268
-
269
-
270
-
271
-
272
-
273
-
274
-
275
-
276
-
277
-
278
-
279
-
280
 |
 |

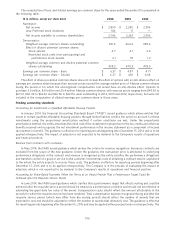
liabilities and accrued expenses or other investments. The accompanying cash flows are included in cash flows from
operating activities in the Consolidated Statements of Cash Flows along with the activities resulting from management
of the proceeds, which for the years ended December 31 are as follows:
($ in millions) 2014 2013 2012
Net change in proceeds managed
Net change in short-term investments $ (167) $ 190 $ (341)
Operating cash flow (used) provided (167) 190 (341)
Net change in cash 9 (6) (5)
Net change in proceeds managed $ (158) $ 184 $ (346)
Net change in liabilities
Liabilities for collateral, beginning of year $ (624) $ (808) $ (462)
Liabilities for collateral, end of year (782) (624) (808)
Operating cash flow provided (used) $ 158 $ (184) $ 346
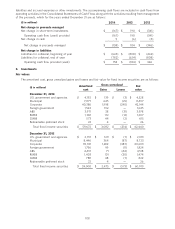
5. Investments
Fair values
The amortized cost, gross unrealized gains and losses and fair value for fixed income securities are as follows:
Gross unrealized
Amortized Fair
($ in millions) cost Gains Losses value
December 31, 2014
U.S. government and agencies $ 4,192 $ 139 $ (3) $ 4,328
Municipal 7,877 645 (25) 8,497
Corporate 40,386 1,998 (240) 42,144
Foreign government 1,543 102 — 1,645
ABS 3,971 38 (31) 3,978
RMBS 1,108 112 (13) 1,207
CMBS 573 44 (2) 615
Redeemable preferred stock 22 4 — 26
Total fixed income securities $ 59,672 $ 3,082 $ (314) $ 62,440
December 31, 2013
U.S. government and agencies $ 2,791 $ 129 $ (7) $ 2,913
Municipal 8,446 364 (87) 8,723
Corporate 39,331 1,659 (387) 40,603
Foreign government 1,736 99 (11) 1,824
ABS 4,491 71 (44) 4,518
RMBS 1,403 101 (30) 1,474
CMBS 788 48 (7) 829
Redeemable preferred stock 22 4 — 26
Total fixed income securities $ 59,008 $ 2,475 $ (573) $ 60,910
108