Allstate 2014 Annual Report Download - page 172
Download and view the complete annual report
Please find page 172 of the 2014 Allstate annual report below. You can navigate through the pages in the report by either clicking on the pages listed below, or by using the keyword search tool below to find specific information within the annual report.-
 1
1 -
2
-
3
-
4
-
5
-
6
-
7
-
8
-
9
-
10
-
11
-
12
-
13
-
14
-
15
-
16
-
17
-
18
-
19
-
20
-
21
-
22
-
23
-
24
-
25
-
26
-
27
-
28
-
29
-
30
-
31
-
32
-
33
-
34
-
35
-
36
-
37
-
38
-
39
-
40
-
41
-
42
-
43
-
44
-
45
-
46
-
47
-
48
-
49
-
50
-
51
-
52
-
53
-
54
-
55
-
56
-
57
-
58
-
59
-
60
-
61
-
62
-
63
-
64
-
65
-
66
-
67
-
68
-
69
-
70
-
71
-
72
-
73
-
74
-
75
-
76
-
77
-
78
-
79
-
80
-
81
-
82
-
83
-
84
-
85
-
86
-
87
-
88
-
89
-
90
-
91
-
92
-
93
-
94
-
95
-
96
-
97
-
98
-
99
-
100
-
101
-
102
-
103
-
104
-
105
-
106
-
107
-
108
-
109
-
110
-
111
-
112
-
113
-
114
-
115
-
116
-
117
-
118
-
119
-
120
-
121
-
122
-
123
-
124
-
125
-
126
-
127
-
128
-
129
-
130
-
131
-
132
-
133
-
134
-
135
-
136
-
137
-
138
-
139
-
140
-
141
-
142
-
143
-
144
-
145
-
146
-
147
-
148
-
149
-
150
-
151
-
152
-
153
-
154
-
155
-
156
-
157
-
158
-
159
-
160
-
161
-
 162
162 -
 163
163 -
 164
164 -
 165
165 -
 166
166 -
 167
167 -
 168
168 -
 169
169 -
 170
170 -
 171
171 -
 172
172 -
 173
173 -
 174
174 -
 175
175 -
 176
176 -
 177
177 -
 178
178 -
 179
179 -
 180
180 -
 181
181 -
 182
182 -
183
-
184
-
185
-
186
-
187
-
188
-
189
-
190
-
191
-
192
-
193
-
194
-
195
-
196
-
197
-
198
-
199
-
200
-
201
-
202
-
203
-
204
-
205
-
206
-
207
-
208
-
209
-
210
-
211
-
212
-
213
-
214
-
215
-
216
-
217
-
218
-
219
-
220
-
221
-
222
-
223
-
224
-
225
-
226
-
227
-
228
-
229
-
230
-
231
-
232
-
233
-
234
-
235
-
236
-
237
-
238
-
239
-
240
-
241
-
242
-
243
-
244
-
245
-
246
-
247
-
248
-
249
-
250
-
251
-
252
-
253
-
254
-
255
-
256
-
257
-
258
-
259
-
260
-
261
-
262
-
263
-
264
-
265
-
266
-
267
-
268
-
269
-
270
-
271
-
272
-
273
-
274
-
275
-
276
-
277
-
278
-
279
-
280
 |
 |

securities serves as credit enhancement for holders of the senior or top portions of the structures. These securities
continue to retain the payment priority features that existed at the origination of the securitization trust. Other forms of
credit enhancement may include structural features embedded in the securitization trust, such as overcollateralization,
excess spread and bond insurance. The underlying collateral can have fixed interest rates, variable interest rates (such
as adjustable rate mortgages) or may contain features of both fixed and variable rate mortgages.
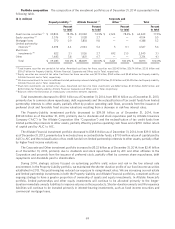
ABS, including CDO and Consumer and other ABS, totaled $3.98 billion as of December 31, 2014, with 95.8% rated
investment grade and an unrealized net capital gain of $7 million. Credit risk is managed by monitoring the performance
of the underlying collateral. Many of the securities in the ABS portfolio have credit enhancement with features such as
overcollateralization, subordinated structures, reserve funds, guarantees and/or insurance.
CDO totaled $1.15 billion as of December 31, 2014, with 87.3% rated investment grade and an unrealized net capital
loss of $16 million. CDO consist of obligations collateralized by cash flow CDO, which are structures collateralized
primarily by below investment grade senior secured corporate loans.
Consumer and other ABS totaled $2.83 billion as of December 31, 2014, with 99.2% rated investment grade.
Consumer and other ABS consists of $1.28 billion of consumer auto, $678 million of credit card and $870 million of
other ABS with unrealized net capital gains of $1 million, $2 million and $20 million, respectively.
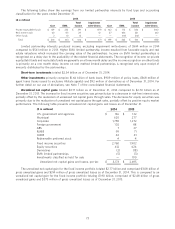
RMBS totaled $1.21 billion as of December 31, 2014, with 31.9% rated investment grade and an unrealized net capital
gain of $99 million. The RMBS portfolio is subject to interest rate risk, but unlike other fixed income securities, is
additionally subject to prepayment risk from the underlying residential mortgage loans. RMBS consists of a U.S. Agency
portfolio having collateral issued or guaranteed by U.S. government agencies and a non-agency portfolio consisting of
securities collateralized by Prime, Alt-A and Subprime loans. The non-agency portfolio totaled $924 million as of
December 31, 2014, with 11.0% rated investment grade and an unrealized net capital gain of $87 million.
CMBS totaled $615 million as of December 31, 2014, with 59.7% rated investment grade and an unrealized net
capital gain of $42 million. The CMBS portfolio is subject to credit risk and has a sequential paydown structure. Of the
CMBS investments, 96.4% are traditional conduit transactions collateralized by commercial mortgage loans, broadly
diversified across property types and geographical area. The remainder consists of non-traditional CMBS such as small
balance transactions, large loan pools and single borrower transactions.
Equity securities primarily include common stocks, exchange traded and mutual funds, non-redeemable preferred
stocks and real estate investment trust equity investments. The equity securities portfolio was $4.10 billion as of
December 31, 2014, with an unrealized net capital gain of $412 million.
Mortgage loans, which are primarily held in the Allstate Financial portfolio, totaled $4.19 billion as of December 31,
2014 and primarily comprise loans secured by first mortgages on developed commercial real estate. Key considerations
used to manage our exposure include property type and geographic diversification. For further detail on our mortgage
loan portfolio, see Note 5 of the consolidated financial statements.
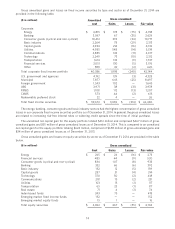
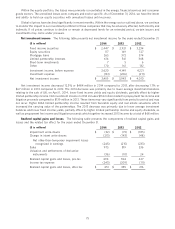
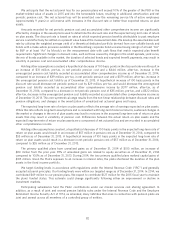
Limited partnership interests consist of investments in private equity/debt, real estate and other funds. The limited
partnership interests portfolio is diversified across a number of characteristics including fund managers, vintage years,
strategies, geography (including international), and company/property types. Tax credit funds were reclassified from
limited partnership interests to other assets during 2014 since their return is in the form of tax credits rather than
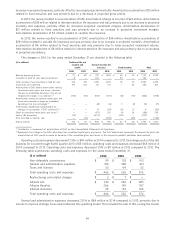
investment income. These tax credit funds totaled $560 million as of December 31, 2014. The following table presents
information about our limited partnership interests as of December 31, 2014.
($ in millions) Private
equity/debt Real estate Other
funds (1) funds funds Total
Cost method of accounting (‘‘Cost’’) $ 894 $ 228 $ — $ 1,122
Equity method of accounting (‘‘EMA’’) 1,862 1,185 358 3,405
Total $ 2,756 $ 1,413 $ 358 $ 4,527
Number of managers 99 37 13 149
Number of individual funds 178 80 19 277
Largest exposure to single fund $ 102 $ 144 $ 145 $ 145
(1) Includes $562 million of infrastructure and real asset funds.
72