Allstate 2014 Annual Report Download - page 140
Download and view the complete annual report
Please find page 140 of the 2014 Allstate annual report below. You can navigate through the pages in the report by either clicking on the pages listed below, or by using the keyword search tool below to find specific information within the annual report.-
 1
1 -
2
-
3
-
4
-
5
-
6
-
7
-
8
-
9
-
10
-
11
-
12
-
13
-
14
-
15
-
16
-
17
-
18
-
19
-
20
-
21
-
22
-
23
-
24
-
25
-
26
-
27
-
28
-
29
-
30
-
31
-
32
-
33
-
34
-
35
-
36
-
37
-
38
-
39
-
40
-
41
-
42
-
43
-
44
-
45
-
46
-
47
-
48
-
49
-
50
-
51
-
52
-
53
-
54
-
55
-
56
-
57
-
58
-
59
-
60
-
61
-
62
-
63
-
64
-
65
-
66
-
67
-
68
-
69
-
70
-
71
-
72
-
73
-
74
-
75
-
76
-
77
-
78
-
79
-
80
-
81
-
82
-
83
-
84
-
85
-
86
-
87
-
88
-
89
-
90
-
91
-
92
-
93
-
94
-
95
-
96
-
97
-
98
-
99
-
100
-
101
-
102
-
103
-
104
-
105
-
106
-
107
-
108
-
109
-
110
-
111
-
112
-
113
-
114
-
115
-
116
-
117
-
118
-
119
-
120
-
121
-
122
-
123
-
124
-
125
-
126
-
127
-
128
-
129
-
 130
130 -
 131
131 -
 132
132 -
 133
133 -
 134
134 -
 135
135 -
 136
136 -
 137
137 -
 138
138 -
 139
139 -
 140
140 -
 141
141 -
 142
142 -
 143
143 -
 144
144 -
 145
145 -
 146
146 -
 147
147 -
 148
148 -
 149
149 -
 150
150 -
151
-
152
-
153
-
154
-
155
-
156
-
157
-
158
-
159
-
160
-
161
-
162
-
163
-
164
-
165
-
166
-
167
-
168
-
169
-
170
-
171
-
172
-
173
-
174
-
175
-
176
-
177
-
178
-
179
-
180
-
181
-
182
-
183
-
184
-
185
-
186
-
187
-
188
-
189
-
190
-
191
-
192
-
193
-
194
-
195
-
196
-
197
-
198
-
199
-
200
-
201
-
202
-
203
-
204
-
205
-
206
-
207
-
208
-
209
-
210
-
211
-
212
-
213
-
214
-
215
-
216
-
217
-
218
-
219
-
220
-
221
-
222
-
223
-
224
-
225
-
226
-
227
-
228
-
229
-
230
-
231
-
232
-
233
-
234
-
235
-
236
-
237
-
238
-
239
-
240
-
241
-
242
-
243
-
244
-
245
-
246
-
247
-
248
-
249
-
250
-
251
-
252
-
253
-
254
-
255
-
256
-
257
-
258
-
259
-
260
-
261
-
262
-
263
-
264
-
265
-
266
-
267
-
268
-
269
-
270
-
271
-
272
-
273
-
274
-
275
-
276
-
277
-
278
-
279
-
280
 |
 |

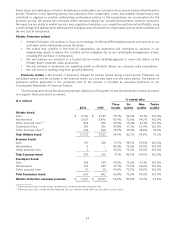
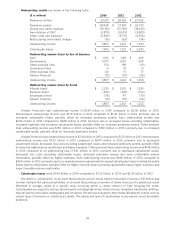
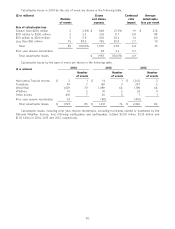
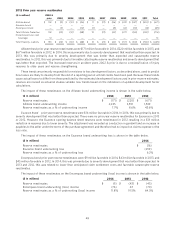
Catastrophe losses in 2014 by the size of event are shown in the following table.
Claims Combined Average($ in millions)
Number and claims ratio catastrophe
of events expense impact loss per event
Size of catastrophe loss
Greater than $250 million 2 2.3% $ 548 27.5% 1.9 $ 274
$101 million to $250 million 2 2.3 235 11.7 0.8 118
$50 million to $100 million 5 5.9 402 20.2 1.4 80
Less than $50 million 76 89.5 765 38.4 2.7 10
Total 85 100.0% 1,950 97.8 6.8 23
Prior year reserve reestimates 43 2.2 0.1
Total catastrophe losses $ 1,993 100.0% 6.9
Catastrophe losses by the type of event are shown in the following table.
2014 2013 2012
($ in millions)
Number Number Number
of events of events of events
Hurricanes/Tropical storms $ 2 1 $ 14 1 $ 1,200 3
Tornadoes 99 2 169 3 297 5
Wind/Hail 1,429 70 1,089 64 1,198 64
Wildfires 19 5 41 5 53 11
Other events 401 7 26 3 7 1
Prior year reserve reestimates 43 (88) (410)
Total catastrophe losses $ 1,993 85 $ 1,251 76 $ 2,345 84
Catastrophe losses, including prior year reserve reestimates, excluding hurricanes named or numbered by the
National Weather Service, fires following earthquakes and earthquakes, totaled $2.00 billion, $1.35 billion and
$1.32 billion in 2014, 2013 and 2012, respectively.
40