Allstate 2014 Annual Report Download - page 265
Download and view the complete annual report
Please find page 265 of the 2014 Allstate annual report below. You can navigate through the pages in the report by either clicking on the pages listed below, or by using the keyword search tool below to find specific information within the annual report.-
 1
1 -
2
-
3
-
4
-
5
-
6
-
7
-
8
-
9
-
10
-
11
-
12
-
13
-
14
-
15
-
16
-
17
-
18
-
19
-
20
-
21
-
22
-
23
-
24
-
25
-
26
-
27
-
28
-
29
-
30
-
31
-
32
-
33
-
34
-
35
-
36
-
37
-
38
-
39
-
40
-
41
-
42
-
43
-
44
-
45
-
46
-
47
-
48
-
49
-
50
-
51
-
52
-
53
-
54
-
55
-
56
-
57
-
58
-
59
-
60
-
61
-
62
-
63
-
64
-
65
-
66
-
67
-
68
-
69
-
70
-
71
-
72
-
73
-
74
-
75
-
76
-
77
-
78
-
79
-
80
-
81
-
82
-
83
-
84
-
85
-
86
-
87
-
88
-
89
-
90
-
91
-
92
-
93
-
94
-
95
-
96
-
97
-
98
-
99
-
100
-
101
-
102
-
103
-
104
-
105
-
106
-
107
-
108
-
109
-
110
-
111
-
112
-
113
-
114
-
115
-
116
-
117
-
118
-
119
-
120
-
121
-
122
-
123
-
124
-
125
-
126
-
127
-
128
-
129
-
130
-
131
-
132
-
133
-
134
-
135
-
136
-
137
-
138
-
139
-
140
-
141
-
142
-
143
-
144
-
145
-
146
-
147
-
148
-
149
-
150
-
151
-
152
-
153
-
154
-
155
-
156
-
157
-
158
-
159
-
160
-
161
-
162
-
163
-
164
-
165
-
166
-
167
-
168
-
169
-
170
-
171
-
172
-
173
-
174
-
175
-
176
-
177
-
178
-
179
-
180
-
181
-
182
-
183
-
184
-
185
-
186
-
187
-
188
-
189
-
190
-
191
-
192
-
193
-
194
-
195
-
196
-
197
-
198
-
199
-
200
-
201
-
202
-
203
-
204
-
205
-
206
-
207
-
208
-
209
-
210
-
211
-
212
-
213
-
214
-
215
-
216
-
217
-
218
-
219
-
220
-
221
-
222
-
223
-
224
-
225
-
226
-
227
-
228
-
229
-
230
-
231
-
232
-
233
-
234
-
235
-
236
-
237
-
238
-
239
-
240
-
241
-
242
-
243
-
244
-
245
-
246
-
247
-
248
-
249
-
250
-
251
-
252
-
253
-
254
-
 255
255 -
 256
256 -
 257
257 -
 258
258 -
 259
259 -
 260
260 -
 261
261 -
 262
262 -
 263
263 -
 264
264 -
 265
265 -
 266
266 -
 267
267 -
 268
268 -
 269
269 -
 270
270 -
 271
271 -
 272
272 -
 273
273 -
 274
274 -
 275
275 -
276
-
277
-
278
-
279
-
280
 |
 |

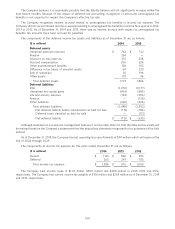
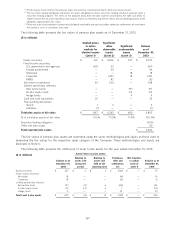
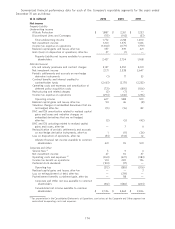
Weighted average assumptions used to determine benefit obligations as of December 31 are listed in the following
table.
Pension benefits Postretirement benefits
2014 2013 2014 2013
Discount rate 4.10% 5.00% 4.15% 4.85%
Rate of increase in compensation levels 3.5 3.5 n/a n/a
The weighted average health care cost trend rate used in measuring the accumulated postretirement benefit cost is
6.8% for 2015, gradually declining to 4.5% in 2024 and remaining at that level thereafter.
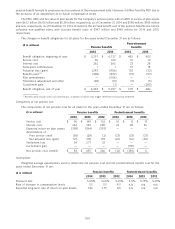
Assumed health care cost trend rates have a significant effect on the amounts reported for the postretirement
health care plans. A one percentage-point increase in assumed health care cost trend rates would increase the total of
the service and interest cost components of net periodic benefit cost of other postretirement benefits and the APBO by
$2 million and $25 million, respectively. A one percentage-point decrease in assumed health care cost trend rates would
decrease the total of the service and interest cost components of net periodic benefit cost of other postretirement
benefits and the APBO by $2 million and $24 million, respectively.
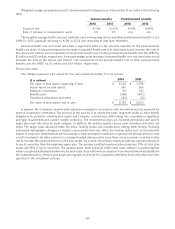
Pension plan assets
The change in pension plan assets for the years ended December 31 is as follows:
2014 2013
($ in millions)
Fair value of plan assets, beginning of year $ 5,602 $ 5,398
Actual return on plan assets 540 566
Employer contribution 49 561
Benefits paid (368) (892)
Translation adjustment and other (40) (31)
Fair value of plan assets, end of year $ 5,783 $ 5,602
In general, the Company’s pension plan assets are managed in accordance with investment policies approved by
pension investment committees. The purpose of the policies is to ensure the plans’ long-term ability to meet benefit
obligations by prudently investing plan assets and Company contributions, while taking into consideration regulatory
and legal requirements and current market conditions. The investment policies are reviewed periodically and specify
target plan asset allocation by asset category. In addition, the policies specify various asset allocation and other risk
limits. The target asset allocation takes the plans’ funding status into consideration, among other factors, including
anticipated demographic changes or liquidity requirements that may affect the funding status such as the potential
impact of lump sum settlements as well as existing or expected market conditions. In general, the allocation has a lower
overall investment risk when a plan is in a stronger funded status position since there is less economic incentive to take
risk to increase the expected returns on the plan assets. As a result, the primary employee plan has a greater allocation
to equity securities than the employee-agent plan. The primary qualified employee plan comprises 79% of total plan
assets and 81% of equity securities. The pension plans’ asset exposure within each asset category is tracked against
widely accepted established benchmarks for each asset class with limits on variation from the benchmark established in
the investment policy. Pension plan assets are regularly monitored for compliance with these limits and other risk limits
specified in the investment policies.
165