Allstate 2014 Annual Report Download - page 62
Download and view the complete annual report
Please find page 62 of the 2014 Allstate annual report below. You can navigate through the pages in the report by either clicking on the pages listed below, or by using the keyword search tool below to find specific information within the annual report.-
 1
1 -
2
-
3
-
4
-
5
-
6
-
7
-
8
-
9
-
10
-
11
-
12
-
13
-
14
-
15
-
16
-
17
-
18
-
19
-
20
-
21
-
22
-
23
-
24
-
25
-
26
-
27
-
28
-
29
-
30
-
31
-
32
-
33
-
34
-
35
-
36
-
37
-
38
-
39
-
40
-
41
-
42
-
43
-
44
-
45
-
46
-
47
-
48
-
49
-
50
-
51
-
 52
52 -
 53
53 -
 54
54 -
 55
55 -
 56
56 -
 57
57 -
 58
58 -
 59
59 -
 60
60 -
 61
61 -
 62
62 -
 63
63 -
 64
64 -
 65
65 -
 66
66 -
 67
67 -
 68
68 -
 69
69 -
 70
70 -
 71
71 -
 72
72 -
73
-
74
-
75
-
76
-
77
-
78
-
79
-
80
-
81
-
82
-
83
-
84
-
85
-
86
-
87
-
88
-
89
-
90
-
91
-
92
-
93
-
94
-
95
-
96
-
97
-
98
-
99
-
100
-
101
-
102
-
103
-
104
-
105
-
106
-
107
-
108
-
109
-
110
-
111
-
112
-
113
-
114
-
115
-
116
-
117
-
118
-
119
-
120
-
121
-
122
-
123
-
124
-
125
-
126
-
127
-
128
-
129
-
130
-
131
-
132
-
133
-
134
-
135
-
136
-
137
-
138
-
139
-
140
-
141
-
142
-
143
-
144
-
145
-
146
-
147
-
148
-
149
-
150
-
151
-
152
-
153
-
154
-
155
-
156
-
157
-
158
-
159
-
160
-
161
-
162
-
163
-
164
-
165
-
166
-
167
-
168
-
169
-
170
-
171
-
172
-
173
-
174
-
175
-
176
-
177
-
178
-
179
-
180
-
181
-
182
-
183
-
184
-
185
-
186
-
187
-
188
-
189
-
190
-
191
-
192
-
193
-
194
-
195
-
196
-
197
-
198
-
199
-
200
-
201
-
202
-
203
-
204
-
205
-
206
-
207
-
208
-
209
-
210
-
211
-
212
-
213
-
214
-
215
-
216
-
217
-
218
-
219
-
220
-
221
-
222
-
223
-
224
-
225
-
226
-
227
-
228
-
229
-
230
-
231
-
232
-
233
-
234
-
235
-
236
-
237
-
238
-
239
-
240
-
241
-
242
-
243
-
244
-
245
-
246
-
247
-
248
-
249
-
250
-
251
-
252
-
253
-
254
-
255
-
256
-
257
-
258
-
259
-
260
-
261
-
262
-
263
-
264
-
265
-
266
-
267
-
268
-
269
-
270
-
271
-
272
-
273
-
274
-
275
-
276
-
277
-
278
-
279
-
280
 |
 |

9MAR201204034531
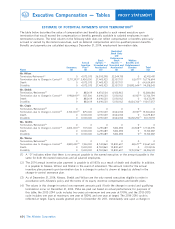
Executive Compensation — Tables
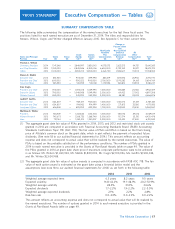
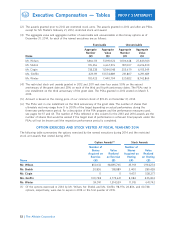
(2) The awards granted prior to 2012 are restricted stock units. The awards granted in 2012 and after are PSAs,
except for Mr. Shebik’s February 21, 2012, restricted stock unit award.
(3) The aggregate value and aggregate number of exercisable and unexercisable in-the-money options as of
December 31, 2014, for each of the named executives are as follows:
Exercisable Unexercisable
Aggregate Aggregate Aggregate Aggregate
Number Value Number Value
Name (#) ($) (#) ($)
Mr. Wilson 1,866,113 51,390,122 1,006,628 27,443,923
Mr. Shebik 195,256 6,667,376 187,007 4,696,530
Mr. Civgin 318,238 11,344,048 255,679 6,915,549
Ms. Greffin 423,119 13,574,889 231,807 6,291,689
Mr. Winter 192,423 7,440,794 320,822 8,742,869
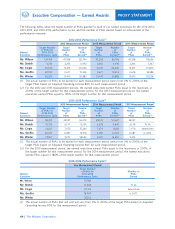
(4) The restricted stock unit awards granted in 2012 and 2011 vest over four years: 50% on the second
anniversary of the grant date and 25% on each of the third and fourth anniversary dates. The PSAs vest in
one installment on the third anniversary of the grant date. The PSAs granted in 2012 vested on March 5,
2015.
(5) Amount is based on the closing price of our common stock of $70.25 on December 31, 2014.
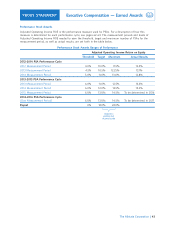
(6) The PSAs vest in one installment on the third anniversary of the grant date. The number of shares that
ultimately vest may range from 0 to 200% of the target depending on actual performance during the
three-year performance period. For a description of the PSA program and the performance measures used,
see pages 36-37 and 43. The number of PSAs reflected in this column for the 2013 and 2014 awards are the
number of shares that would be earned if the target level of performance is achieved. Final payouts under the
PSAs will not be known until the respective performance period is completed.
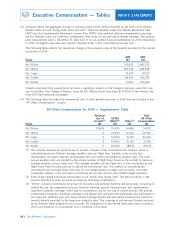
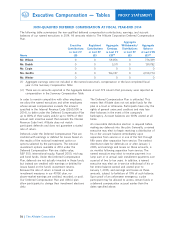
OPTION EXERCISES AND STOCK VESTED AT FISCAL YEAR-END 2014
The following table summarizes the options exercised by the named executives during 2014 and the restricted
stock unit awards that vested during 2014.
Option Awards(1) Stock Awards
Mr. Wilson 850,612 38,895,765 35,913 1,934,274
Mr. Shebik 20,836 138,889 5,400 289,428
Mr. Civgin 0 0 9,437 508,277
Ms. Greffin 100,748 2,775,621 8,084 435,404
Mr. Winter 59,091 1,314,559 11,915 641,742
(1) Of the options exercised in 2014 by Mr. Wilson, Mr. Shebik and Ms. Greffin, 98,976, 20,836, and 40,748
options, respectively, were due to expire in 2014 or the first quarter of 2015.
52
PROXY STATEMENT
Number of Number of
Shares Value Shares Value
Acquired on Realized Acquired on Realized
Exercise on Exercise Vesting on Vesting
Name (#) ($) (#) ($)
The Allstate Corporation