Allstate 2014 Annual Report Download - page 212
Download and view the complete annual report
Please find page 212 of the 2014 Allstate annual report below. You can navigate through the pages in the report by either clicking on the pages listed below, or by using the keyword search tool below to find specific information within the annual report.-
 1
1 -
2
-
3
-
4
-
5
-
6
-
7
-
8
-
9
-
10
-
11
-
12
-
13
-
14
-
15
-
16
-
17
-
18
-
19
-
20
-
21
-
22
-
23
-
24
-
25
-
26
-
27
-
28
-
29
-
30
-
31
-
32
-
33
-
34
-
35
-
36
-
37
-
38
-
39
-
40
-
41
-
42
-
43
-
44
-
45
-
46
-
47
-
48
-
49
-
50
-
51
-
52
-
53
-
54
-
55
-
56
-
57
-
58
-
59
-
60
-
61
-
62
-
63
-
64
-
65
-
66
-
67
-
68
-
69
-
70
-
71
-
72
-
73
-
74
-
75
-
76
-
77
-
78
-
79
-
80
-
81
-
82
-
83
-
84
-
85
-
86
-
87
-
88
-
89
-
90
-
91
-
92
-
93
-
94
-
95
-
96
-
97
-
98
-
99
-
100
-
101
-
102
-
103
-
104
-
105
-
106
-
107
-
108
-
109
-
110
-
111
-
112
-
113
-
114
-
115
-
116
-
117
-
118
-
119
-
120
-
121
-
122
-
123
-
124
-
125
-
126
-
127
-
128
-
129
-
130
-
131
-
132
-
133
-
134
-
135
-
136
-
137
-
138
-
139
-
140
-
141
-
142
-
143
-
144
-
145
-
146
-
147
-
148
-
149
-
150
-
151
-
152
-
153
-
154
-
155
-
156
-
157
-
158
-
159
-
160
-
161
-
162
-
163
-
164
-
165
-
166
-
167
-
168
-
169
-
170
-
171
-
172
-
173
-
174
-
175
-
176
-
177
-
178
-
179
-
180
-
181
-
182
-
183
-
184
-
185
-
186
-
187
-
188
-
189
-
190
-
191
-
192
-
193
-
194
-
195
-
196
-
197
-
198
-
199
-
200
-
201
-
 202
202 -
 203
203 -
 204
204 -
 205
205 -
 206
206 -
 207
207 -
 208
208 -
 209
209 -
 210
210 -
 211
211 -
 212
212 -
 213
213 -
 214
214 -
 215
215 -
 216
216 -
 217
217 -
 218
218 -
 219
219 -
 220
220 -
 221
221 -
 222
222 -
223
-
224
-
225
-
226
-
227
-
228
-
229
-
230
-
231
-
232
-
233
-
234
-
235
-
236
-
237
-
238
-
239
-
240
-
241
-
242
-
243
-
244
-
245
-
246
-
247
-
248
-
249
-
250
-
251
-
252
-
253
-
254
-
255
-
256
-
257
-
258
-
259
-
260
-
261
-
262
-
263
-
264
-
265
-
266
-
267
-
268
-
269
-
270
-
271
-
272
-
273
-
274
-
275
-
276
-
277
-
278
-
279
-
280
 |
 |

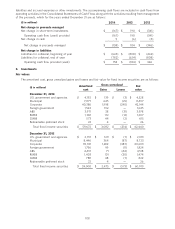
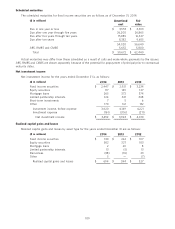
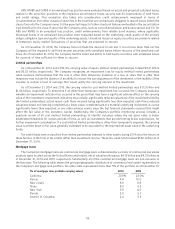
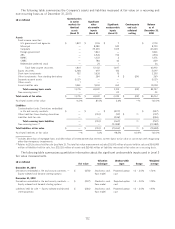
Unrealized net capital gains and losses
Unrealized net capital gains and losses included in accumulated other comprehensive income are as follows:
Gross unrealized
Fair Unrealized net
($ in millions) value Gains Losses gains (losses)
December 31, 2014
Fixed income securities $ 62,440 $ 3,082 $ (314) $ 2,768
Equity securities 4,104 467 (55) 412
Short-term investments 2,540 — — —
Derivative instruments (1) 2 3 (5) (2)
Equity method (‘‘EMA’’) limited partnerships (2) (5)
Unrealized net capital gains and losses, pre-tax 3,173
Amounts recognized for:
Insurance reserves (3) (28)
DAC and DSI (4) (179)
Amounts recognized (207)
Deferred income taxes (1,040)
Unrealized net capital gains and losses, after-tax $ 1,926
(1) Included in the fair value of derivative instruments are $3 million classified as assets and $1 million classified as liabilities.
(2) Unrealized net capital gains and losses for limited partnership interests represent the Company’s share of EMA limited partnerships’ other
comprehensive income. Fair value and gross unrealized gains and losses are not applicable.
(3) The insurance reserves adjustment represents the amount by which the reserve balance would increase if the net unrealized gains in the applicable
product portfolios were realized and reinvested at current lower interest rates, resulting in a premium deficiency. Although the Company evaluates
premium deficiencies on the combined performance of life insurance and immediate annuities with life contingencies, the adjustment primarily
relates to structured settlement annuities with life contingencies, in addition to annuity buy-outs and certain payout annuities with life
contingencies.
(4) The DAC and DSI adjustment balance represents the amount by which the amortization of DAC and DSI would increase or decrease if the
unrealized gains or losses in the respective product portfolios were realized.
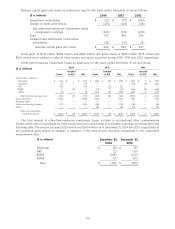
Gross unrealized
Fair Unrealized net
($ in millions) value Gains Losses gains (losses)
December 31, 2013
Fixed income securities $ 60,910 $ 2,475 $ (573) $ 1,902
Equity securities 5,097 658 (34) 624
Short-term investments 2,393 — — —
Derivative instruments (1) (13) 1 (19) (18)
EMA limited partnerships (3)
Investments classified as held for sale 190
Unrealized net capital gains and losses, pre-tax 2,695
Amounts recognized for:
Insurance reserves —
DAC and DSI (158)
Amounts recognized (158)
Deferred income taxes (891)
Unrealized net capital gains and losses, after-tax $ 1,646
(1) Included in the fair value of derivative instruments are $1 million classified as assets and $14 million classified as liabilities.
112