Allstate 2014 Annual Report Download - page 136
Download and view the complete annual report
Please find page 136 of the 2014 Allstate annual report below. You can navigate through the pages in the report by either clicking on the pages listed below, or by using the keyword search tool below to find specific information within the annual report.-
 1
1 -
2
-
3
-
4
-
5
-
6
-
7
-
8
-
9
-
10
-
11
-
12
-
13
-
14
-
15
-
16
-
17
-
18
-
19
-
20
-
21
-
22
-
23
-
24
-
25
-
26
-
27
-
28
-
29
-
30
-
31
-
32
-
33
-
34
-
35
-
36
-
37
-
38
-
39
-
40
-
41
-
42
-
43
-
44
-
45
-
46
-
47
-
48
-
49
-
50
-
51
-
52
-
53
-
54
-
55
-
56
-
57
-
58
-
59
-
60
-
61
-
62
-
63
-
64
-
65
-
66
-
67
-
68
-
69
-
70
-
71
-
72
-
73
-
74
-
75
-
76
-
77
-
78
-
79
-
80
-
81
-
82
-
83
-
84
-
85
-
86
-
87
-
88
-
89
-
90
-
91
-
92
-
93
-
94
-
95
-
96
-
97
-
98
-
99
-
100
-
101
-
102
-
103
-
104
-
105
-
106
-
107
-
108
-
109
-
110
-
111
-
112
-
113
-
114
-
115
-
116
-
117
-
118
-
119
-
120
-
121
-
122
-
123
-
124
-
125
-
 126
126 -
 127
127 -
 128
128 -
 129
129 -
 130
130 -
 131
131 -
 132
132 -
 133
133 -
 134
134 -
 135
135 -
 136
136 -
 137
137 -
 138
138 -
 139
139 -
 140
140 -
 141
141 -
 142
142 -
 143
143 -
 144
144 -
 145
145 -
 146
146 -
147
-
148
-
149
-
150
-
151
-
152
-
153
-
154
-
155
-
156
-
157
-
158
-
159
-
160
-
161
-
162
-
163
-
164
-
165
-
166
-
167
-
168
-
169
-
170
-
171
-
172
-
173
-
174
-
175
-
176
-
177
-
178
-
179
-
180
-
181
-
182
-
183
-
184
-
185
-
186
-
187
-
188
-
189
-
190
-
191
-
192
-
193
-
194
-
195
-
196
-
197
-
198
-
199
-
200
-
201
-
202
-
203
-
204
-
205
-
206
-
207
-
208
-
209
-
210
-
211
-
212
-
213
-
214
-
215
-
216
-
217
-
218
-
219
-
220
-
221
-
222
-
223
-
224
-
225
-
226
-
227
-
228
-
229
-
230
-
231
-
232
-
233
-
234
-
235
-
236
-
237
-
238
-
239
-
240
-
241
-
242
-
243
-
244
-
245
-
246
-
247
-
248
-
249
-
250
-
251
-
252
-
253
-
254
-
255
-
256
-
257
-
258
-
259
-
260
-
261
-
262
-
263
-
264
-
265
-
266
-
267
-
268
-
269
-
270
-
271
-
272
-
273
-
274
-
275
-
276
-
277
-
278
-
279
-
280
 |
 |

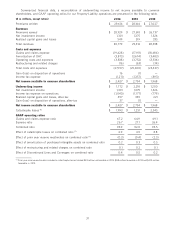
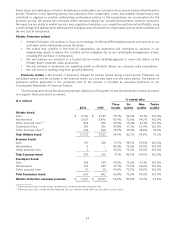
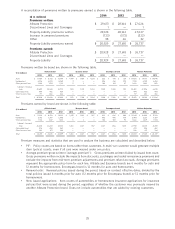
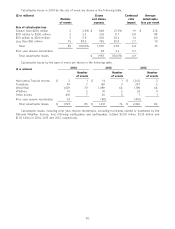
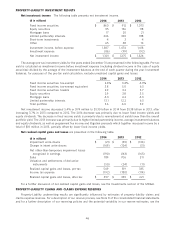
Auto premiums written totaled $19.67 billion in 2014, a 5.2% increase from $18.70 billion in 2013, following a 3.7%
increase in 2013 from $18.04 billion in 2012.
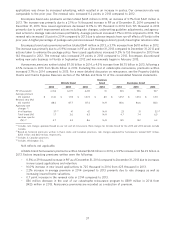
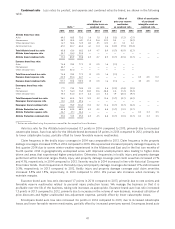
Allstate brand Esurance brand Encompass brand
2014 2013 2012 2014 2013 2012 2014 2013 2012
PIF (thousands) 19,916 19,362 19,084 1,424 1,286 1,029 790 774 731
Average premium (1) $ 479 $ 468 $ 458 $ 499 $ 485 $ 493 $ 895 $ 880 $ 890
Renewal ratio (%) 88.9 88.6 87.9 79.5 80.7 80.5 79.7 78.7 75.8
Approved rate changes (2):
# of locations 46 (6) 39 42 38 31 29 29 29 31
Total brand (%) (3) 2.3 (7) 1.9 3.0 6.0 4.8 4.4 6.6 5.9 4.1
Location specific
(%) (4)(5) 3.2 3.2 5.0 6.9 6.5 5.6 7.9 7.0 5.2
(1) Policy term is six months for Allstate and Esurance brands and twelve months for Encompass brand.
(2) Rate changes that are indicated based on loss trend analysis to achieve a targeted return will continue to be pursued. Rate changes do not include
rating plan enhancements, including the introduction of discounts and surcharges that result in no change in the overall rate level in the state. These
rate changes do not reflect initial rates filed for insurance subsidiaries initially writing business in a state. Rate changes for Allstate brand for the
2013 and 2012 periods exclude Canada and specialty auto.
(3) Represents the impact in the states and Canadian provinces where rate changes were approved during the period as a percentage of total brand
prior year-end premiums written.
(4) Represents the impact in the states and Canadian provinces where rate changes were approved during the period as a percentage of its respective
total prior year-end premiums written in those same locations.
(5) Based on historical premiums written in those states and Canadian provinces, rate changes approved for auto totaled $520 million, $379 million
and $539 million in 2014, 2013 and 2012, respectively.
(6) 2014 includes 4 Canadian provinces and Washington D.C.
(7) Allstate brand (excluding Canada) rate changes in 2014 were 2.9%.
Allstate brand auto premiums written totaled $17.50 billion in 2014, a 4.5% increase from $16.75 billion in 2013.
Factors impacting premiums written were the following:
– 2.9% or 554 thousand increase in PIF as of December 31, 2014 compared to December 31, 2013.
– 10.3% increase in new issued applications to 3,033 thousand in 2014 from 2,749 thousand in 2013.
– 2.4% increase in average premium in 2014 compared to 2013.
– 0.3 point increase in the renewal ratio in 2014 compared to 2013.
Allstate brand auto premiums written totaled $16.75 billion in 2013, a 2.2% increase from $16.40 billion in 2012.
Factors impacting premiums written were the following:
– 1.5% increase in PIF as of December 31, 2013 compared to December 31, 2012.
– 12.5% increase in new issued applications to 2,749 thousand in 2013 from 2,443 thousand in 2012.
– 2.2% increase in average premium in 2013 compared to 2012.
– 0.7 point increase in the renewal ratio in 2013 compared to 2012.
Esurance brand auto premiums written totaled $1.50 billion in 2014, an increase of 14.6% from $1.31 billion in 2013.
The increase was primarily due to a 10.7% or 138 thousand increase in PIF as of December 31, 2014 compared to
December 31, 2013. New issued applications of 747 thousand in 2014 was comparable to 2013. An increase in quote
volume driven by the new advertising program was offset by a decrease in conversion rate (the percentage of completed
quotes to actual issued policies) primarily due to rate actions. Rate actions are taken where profit margin targets are not
being achieved. The rate changes in 2014 were taken in states and risk categories to improve profit margin while
managing customer retention. Average premium increased 2.9% in 2014 compared to 2013.
Esurance brand renewal ratio decreased 1.2 points in 2014 compared to 2013. The renewal ratio for the direct to
consumer business is generally lower than agency written business consistent with the direct consumer tendency to
shop and change providers based on competitive rates. The renewal ratio is also typically lowest at the first renewal date
for new business. The decrease in the renewal ratio during 2014 was due to the impact of rate increases and growth in
states with lower retention, partially offset by an increase in the amount of business past its first renewal. Retention may
continue to be impacted as a result of expansion initiatives that increase the areas in which Esurance writes business.
Retention at first renewal was 70.4% during 2014 compared to 72.8% in 2013. The renewal ratio on business
subsequent to first renewal was 82.7% during 2014 compared to 84.1% in 2013.
Esurance brand auto premiums written totaled $1.31 billion in 2013, a 27.7% increase from $1.02 billion in 2012. The
increase was primarily due to a 25.0% increase in PIF as of December 31, 2013 compared to December 31, 2012. New
issued applications increased 23.5% to 747 thousand in 2013 from 605 thousand in 2012. Growth in new issued
36