Allstate 2014 Annual Report Download - page 234
Download and view the complete annual report
Please find page 234 of the 2014 Allstate annual report below. You can navigate through the pages in the report by either clicking on the pages listed below, or by using the keyword search tool below to find specific information within the annual report.-
 1
1 -
2
-
3
-
4
-
5
-
6
-
7
-
8
-
9
-
10
-
11
-
12
-
13
-
14
-
15
-
16
-
17
-
18
-
19
-
20
-
21
-
22
-
23
-
24
-
25
-
26
-
27
-
28
-
29
-
30
-
31
-
32
-
33
-
34
-
35
-
36
-
37
-
38
-
39
-
40
-
41
-
42
-
43
-
44
-
45
-
46
-
47
-
48
-
49
-
50
-
51
-
52
-
53
-
54
-
55
-
56
-
57
-
58
-
59
-
60
-
61
-
62
-
63
-
64
-
65
-
66
-
67
-
68
-
69
-
70
-
71
-
72
-
73
-
74
-
75
-
76
-
77
-
78
-
79
-
80
-
81
-
82
-
83
-
84
-
85
-
86
-
87
-
88
-
89
-
90
-
91
-
92
-
93
-
94
-
95
-
96
-
97
-
98
-
99
-
100
-
101
-
102
-
103
-
104
-
105
-
106
-
107
-
108
-
109
-
110
-
111
-
112
-
113
-
114
-
115
-
116
-
117
-
118
-
119
-
120
-
121
-
122
-
123
-
124
-
125
-
126
-
127
-
128
-
129
-
130
-
131
-
132
-
133
-
134
-
135
-
136
-
137
-
138
-
139
-
140
-
141
-
142
-
143
-
144
-
145
-
146
-
147
-
148
-
149
-
150
-
151
-
152
-
153
-
154
-
155
-
156
-
157
-
158
-
159
-
160
-
161
-
162
-
163
-
164
-
165
-
166
-
167
-
168
-
169
-
170
-
171
-
172
-
173
-
174
-
175
-
176
-
177
-
178
-
179
-
180
-
181
-
182
-
183
-
184
-
185
-
186
-
187
-
188
-
189
-
190
-
191
-
192
-
193
-
194
-
195
-
196
-
197
-
198
-
199
-
200
-
201
-
202
-
203
-
204
-
205
-
206
-
207
-
208
-
209
-
210
-
211
-
212
-
213
-
214
-
215
-
216
-
217
-
218
-
219
-
220
-
221
-
222
-
223
-
 224
224 -
 225
225 -
 226
226 -
 227
227 -
 228
228 -
 229
229 -
 230
230 -
 231
231 -
 232
232 -
 233
233 -
 234
234 -
 235
235 -
 236
236 -
 237
237 -
 238
238 -
 239
239 -
 240
240 -
 241
241 -
 242
242 -
 243
243 -
 244
244 -
245
-
246
-
247
-
248
-
249
-
250
-
251
-
252
-
253
-
254
-
255
-
256
-
257
-
258
-
259
-
260
-
261
-
262
-
263
-
264
-
265
-
266
-
267
-
268
-
269
-
270
-
271
-
272
-
273
-
274
-
275
-
276
-
277
-
278
-
279
-
280
 |
 |

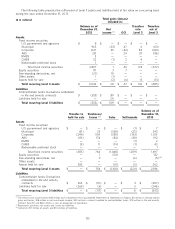
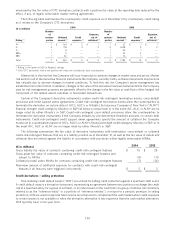
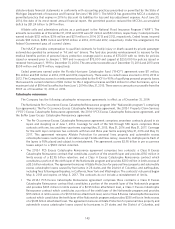
measured by the fair value of OTC derivative contracts with a positive fair value at the reporting date reduced by the
effect, if any, of legally enforceable master netting agreements.
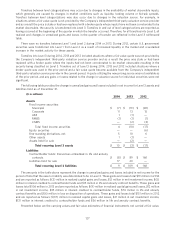
The following table summarizes the counterparty credit exposure as of December 31 by counterparty credit rating
as it relates to the Company’s OTC derivatives.
2014 2013
($ in millions)
Number Number
of Exposure, of Exposure,
counter- Notional Credit net of counter- Notional Credit net of
Rating (1) parties amount (2) exposure (2) collateral (2) parties amount (2) exposure (2) collateral (2)
A+ 1$ 164$ 2$ 1 1$ 22$ 1$ 1
A 3 118 3 2 5 1,628 9 2
Aⳮ1 8 — — 1 24 1 —
BBB+ 1 11 — — 1 33 3 —
BBB 1 52 — — 1 76 1 —
Total 7 $ 353 $ 5 $ 3 9 $ 1,783 $ 15 $ 3
(1) Rating is the lower of S&P or Moody’s ratings.
(2) Only OTC derivatives with a net positive fair value are included for each counterparty.
Market risk is the risk that the Company will incur losses due to adverse changes in market rates and prices. Market
risk exists for all of the derivative financial instruments the Company currently holds, as these instruments may become
less valuable due to adverse changes in market conditions. To limit this risk, the Company’s senior management has
established risk control limits. In addition, changes in fair value of the derivative financial instruments that the Company
uses for risk management purposes are generally offset by the change in the fair value or cash flows of the hedged risk
component of the related assets, liabilities or forecasted transactions.
Certain of the Company’s derivative instruments contain credit-risk-contingent termination events, cross-default
provisions and credit support annex agreements. Credit-risk-contingent termination events allow the counterparties to
terminate the derivative on certain dates if AIC’s, ALIC’s or Allstate Life Insurance Company of New York’s (‘‘ALNY’’)
financial strength credit ratings by Moody’s or S&P fall below a certain level or in the event AIC, ALIC or ALNY are no
longer rated by either Moody’s or S&P. Credit-risk-contingent cross-default provisions allow the counterparties to
terminate the derivative instruments if the Company defaults by pre-determined threshold amounts on certain debt
instruments. Credit-risk-contingent credit support annex agreements specify the amount of collateral the Company
must post to counterparties based on AIC’s, ALIC’s or ALNY’s financial strength credit ratings by Moody’s or S&P, or in
the event AIC, ALIC or ALNY are no longer rated by either Moody’s or S&P.
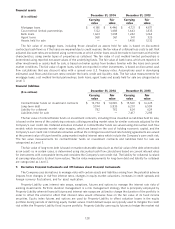
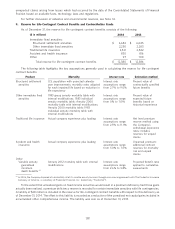
The following summarizes the fair value of derivative instruments with termination, cross-default or collateral
credit-risk-contingent features that are in a liability position as of December 31, as well as the fair value of assets and
collateral that are netted against the liability in accordance with provisions within legally enforceable MNAs.
2014 2013
($ in millions)
Gross liability fair value of contracts containing credit-risk-contingent features $ 16 $ 28
Gross asset fair value of contracts containing credit-risk-contingent features and
subject to MNAs (4) (11)
Collateral posted under MNAs for contracts containing credit-risk-contingent features (7) (14)
Maximum amount of additional exposure for contracts with credit-risk-contingent
features if all features were triggered concurrently $ 5 $ 3
Credit derivatives – selling protection
Free-standing credit default swaps (‘‘CDS’’) are utilized for selling credit protection against a specified credit event.
A credit default swap is a derivative instrument, representing an agreement between two parties to exchange the credit
risk of a specified entity (or a group of entities), or an index based on the credit risk of a group of entities (all commonly
referred to as the ‘‘reference entity’’ or a portfolio of ‘‘reference entities’’), in return for a periodic premium. In selling
protection, CDS are used to replicate fixed income securities and to complement the cash market when credit exposure
to certain issuers is not available or when the derivative alternative is less expensive than the cash market alternative.
CDS typically have a five-year term.
134