Allstate 2014 Annual Report Download - page 237
Download and view the complete annual report
Please find page 237 of the 2014 Allstate annual report below. You can navigate through the pages in the report by either clicking on the pages listed below, or by using the keyword search tool below to find specific information within the annual report.-
 1
1 -
2
-
3
-
4
-
5
-
6
-
7
-
8
-
9
-
10
-
11
-
12
-
13
-
14
-
15
-
16
-
17
-
18
-
19
-
20
-
21
-
22
-
23
-
24
-
25
-
26
-
27
-
28
-
29
-
30
-
31
-
32
-
33
-
34
-
35
-
36
-
37
-
38
-
39
-
40
-
41
-
42
-
43
-
44
-
45
-
46
-
47
-
48
-
49
-
50
-
51
-
52
-
53
-
54
-
55
-
56
-
57
-
58
-
59
-
60
-
61
-
62
-
63
-
64
-
65
-
66
-
67
-
68
-
69
-
70
-
71
-
72
-
73
-
74
-
75
-
76
-
77
-
78
-
79
-
80
-
81
-
82
-
83
-
84
-
85
-
86
-
87
-
88
-
89
-
90
-
91
-
92
-
93
-
94
-
95
-
96
-
97
-
98
-
99
-
100
-
101
-
102
-
103
-
104
-
105
-
106
-
107
-
108
-
109
-
110
-
111
-
112
-
113
-
114
-
115
-
116
-
117
-
118
-
119
-
120
-
121
-
122
-
123
-
124
-
125
-
126
-
127
-
128
-
129
-
130
-
131
-
132
-
133
-
134
-
135
-
136
-
137
-
138
-
139
-
140
-
141
-
142
-
143
-
144
-
145
-
146
-
147
-
148
-
149
-
150
-
151
-
152
-
153
-
154
-
155
-
156
-
157
-
158
-
159
-
160
-
161
-
162
-
163
-
164
-
165
-
166
-
167
-
168
-
169
-
170
-
171
-
172
-
173
-
174
-
175
-
176
-
177
-
178
-
179
-
180
-
181
-
182
-
183
-
184
-
185
-
186
-
187
-
188
-
189
-
190
-
191
-
192
-
193
-
194
-
195
-
196
-
197
-
198
-
199
-
200
-
201
-
202
-
203
-
204
-
205
-
206
-
207
-
208
-
209
-
210
-
211
-
212
-
213
-
214
-
215
-
216
-
217
-
218
-
219
-
220
-
221
-
222
-
223
-
224
-
225
-
226
-
 227
227 -
 228
228 -
 229
229 -
 230
230 -
 231
231 -
 232
232 -
 233
233 -
 234
234 -
 235
235 -
 236
236 -
 237
237 -
 238
238 -
 239
239 -
 240
240 -
 241
241 -
 242
242 -
 243
243 -
 244
244 -
 245
245 -
 246
246 -
 247
247 -
248
-
249
-
250
-
251
-
252
-
253
-
254
-
255
-
256
-
257
-
258
-
259
-
260
-
261
-
262
-
263
-
264
-
265
-
266
-
267
-
268
-
269
-
270
-
271
-
272
-
273
-
274
-
275
-
276
-
277
-
278
-
279
-
280
 |
 |

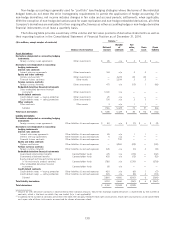
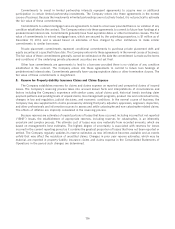
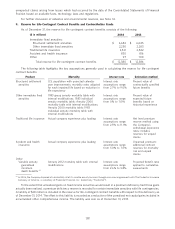
Activity in the reserve for property-liability insurance claims and claims expense is summarized as follows:
($ in millions) 2014 2013 2012
Balance as of January 1 $ 21,857 $ 21,288 $ 20,375
Less reinsurance recoverables 4,664 4,010 2,588
Net balance as of January 1 17,193 17,278 17,787
Esurance acquisition — — (13) (1)
Incurred claims and claims expense related to:
Current year 19,512 18,032 19,149
Prior years (84) (121) (665)
Total incurred 19,428 17,911 18,484
Claims and claims expense paid related to:
Current year 12,924 11,658 12,545
Prior years 6,468 6,338 6,435
Total paid 19,392 17,996 18,980
Net balance as of December 31 17,229 17,193 17,278
Plus reinsurance recoverables 5,694 4,664 4,010
Balance as of December 31 $ 22,923 $ 21,857 $ 21,288
(1) The Esurance opening balance sheet reserves were reestimated in 2012 resulting in a reduction in reserves due to lower severity. The
adjustment was recorded as a reduction in goodwill and an increase in payables to the seller under the terms of the purchase
agreement and therefore had no impact on claims expense.
Incurred claims and claims expense represents the sum of paid losses and reserve changes in the calendar year.
This expense includes losses from catastrophes of $1.99 billion, $1.25 billion and $2.35 billion in 2014, 2013 and 2012,
respectively, net of reinsurance and other recoveries (see Note 10). Catastrophes are an inherent risk of the
property-liability insurance business that have contributed to, and will continue to contribute to, material year-to-year
fluctuations in the Company’s results of operations and financial position.
The Company calculates and records a single best reserve estimate for losses from catastrophes, in conformance
with generally accepted actuarial standards. As a result, management believes that no other estimate is better than the
recorded amount. Due to the uncertainties involved, including the factors described above, the ultimate cost of losses
may vary materially from recorded amounts, which are based on management’s best estimates. Accordingly,
management believes that it is not practical to develop a meaningful range for any such changes in losses incurred.
During 2014, incurred claims and claims expense related to prior years was primarily composed of net decreases in
auto reserves of $238 million primarily due to claim severity development that was better than expected, net increases
in homeowners reserves of $29 million due to unfavorable catastrophe reserve reestimates, net increases in other
reserves of $13 million, and net increases in Discontinued Lines and Coverages reserves of $112 million. Incurred claims
and claims expense includes unfavorable catastrophe loss reestimates of $43 million, net of reinsurance and other
recoveries.
During 2013, incurred claims and claims expense related to prior years was primarily composed of net decreases in
auto reserves of $237 million primarily due to claim severity development that was better than expected, net decreases
in homeowners reserves of $5 million due to favorable non-catastrophe reserve reestimates, net decreases in other
reserves of $21 million, and net increases in Discontinued Lines and Coverages reserves of $142 million. Incurred claims
and claims expense includes favorable catastrophe loss reestimates of $88 million, net of reinsurance and other
recoveries.
During 2012, incurred claims and claims expense related to prior years was primarily composed of net decreases in
auto reserves of $365 million primarily due to claim severity development that was better than expected, net decreases
in homeowners reserves of $321 million due to favorable catastrophe reserve reestimates, net decreases in other
reserves of $30 million, and net increases in Discontinued Lines and Coverages reserves of $51 million. Incurred claims
and claims expense includes favorable catastrophe loss reestimates of $410 million, net of reinsurance and other
recoveries.
Management believes that the reserve for property-liability insurance claims and claims expense, net of reinsurance
recoverables, is appropriately established in the aggregate and adequate to cover the ultimate net cost of reported and
137