Allstate 2014 Annual Report Download - page 47
Download and view the complete annual report
Please find page 47 of the 2014 Allstate annual report below. You can navigate through the pages in the report by either clicking on the pages listed below, or by using the keyword search tool below to find specific information within the annual report.-
 1
1 -
2
-
3
-
4
-
5
-
6
-
7
-
8
-
9
-
10
-
11
-
12
-
13
-
14
-
15
-
16
-
17
-
18
-
19
-
20
-
21
-
22
-
23
-
24
-
25
-
26
-
27
-
28
-
29
-
30
-
31
-
32
-
33
-
34
-
35
-
36
-
 37
37 -
 38
38 -
 39
39 -
 40
40 -
 41
41 -
 42
42 -
 43
43 -
 44
44 -
 45
45 -
 46
46 -
 47
47 -
 48
48 -
 49
49 -
 50
50 -
 51
51 -
 52
52 -
 53
53 -
 54
54 -
 55
55 -
 56
56 -
 57
57 -
58
-
59
-
60
-
61
-
62
-
63
-
64
-
65
-
66
-
67
-
68
-
69
-
70
-
71
-
72
-
73
-
74
-
75
-
76
-
77
-
78
-
79
-
80
-
81
-
82
-
83
-
84
-
85
-
86
-
87
-
88
-
89
-
90
-
91
-
92
-
93
-
94
-
95
-
96
-
97
-
98
-
99
-
100
-
101
-
102
-
103
-
104
-
105
-
106
-
107
-
108
-
109
-
110
-
111
-
112
-
113
-
114
-
115
-
116
-
117
-
118
-
119
-
120
-
121
-
122
-
123
-
124
-
125
-
126
-
127
-
128
-
129
-
130
-
131
-
132
-
133
-
134
-
135
-
136
-
137
-
138
-
139
-
140
-
141
-
142
-
143
-
144
-
145
-
146
-
147
-
148
-
149
-
150
-
151
-
152
-
153
-
154
-
155
-
156
-
157
-
158
-
159
-
160
-
161
-
162
-
163
-
164
-
165
-
166
-
167
-
168
-
169
-
170
-
171
-
172
-
173
-
174
-
175
-
176
-
177
-
178
-
179
-
180
-
181
-
182
-
183
-
184
-
185
-
186
-
187
-
188
-
189
-
190
-
191
-
192
-
193
-
194
-
195
-
196
-
197
-
198
-
199
-
200
-
201
-
202
-
203
-
204
-
205
-
206
-
207
-
208
-
209
-
210
-
211
-
212
-
213
-
214
-
215
-
216
-
217
-
218
-
219
-
220
-
221
-
222
-
223
-
224
-
225
-
226
-
227
-
228
-
229
-
230
-
231
-
232
-
233
-
234
-
235
-
236
-
237
-
238
-
239
-
240
-
241
-
242
-
243
-
244
-
245
-
246
-
247
-
248
-
249
-
250
-
251
-
252
-
253
-
254
-
255
-
256
-
257
-
258
-
259
-
260
-
261
-
262
-
263
-
264
-
265
-
266
-
267
-
268
-
269
-
270
-
271
-
272
-
273
-
274
-
275
-
276
-
277
-
278
-
279
-
280
 |
 |

9MAR201204034531
23MAR201512264225
15MAR201517143126
Executive Compensation — Design
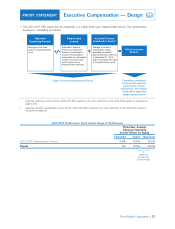
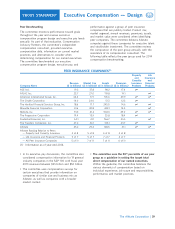
• The 2015-2017 PSA award will be measured in a single three-year measurement period. The performance
measure is calculated as follows:
Average for the three
years in the performance
cycle.
Adjusted to reflect a
minimum or maximum
amount of catastrophe
losses if the average of
actual after-tax catastrophe
losses in the three-year
cycle is less than or
exceeds those amounts.
Average of common
shareholders’ equity
excluding unrealized
gains and losses, after-tax,
at December 31, 2014,
and at the end of each year
in the performance cycle.
Committee considered
historical and expected
performance, market
expectaions, and industry
trends when approving
ran
g
e of performance.
Single Three-Year Measurement Period
Adjusted
Operating Income*
Catastrophe
Losses
Adjusted Common
Shareholders’ Equity**
PSA Performance
Measure
* Adjusted operating income for the 2015-2017 PSA award has the same definition as the 2014-2016 award as disclosed on
page 62-63.
** Adjusted common shareholders’ equity for the 2015-2017 PSA award has the same definition as the 2014-2016 award as
disclosed on page 63.
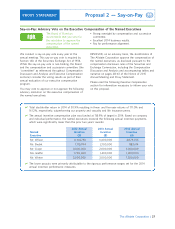
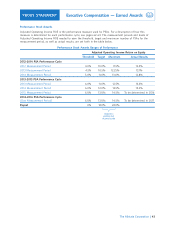
Three-Year Average
Adjusted Operating
Income Return on Equity
6.0% 13.5% 14.5%
Payout 0% 100% 200%
Subject to
positive net
income hurdle
37
PROXY STATEMENT
2015-2017 Performance Stock Award Range of Performance
Threshold Target Maximum
2015-2017 Measurement Period
The Allstate Corporation