Allstate 2014 Annual Report Download - page 175
Download and view the complete annual report
Please find page 175 of the 2014 Allstate annual report below. You can navigate through the pages in the report by either clicking on the pages listed below, or by using the keyword search tool below to find specific information within the annual report.-
 1
1 -
 2
2 -
 3
3 -
 4
4 -
 5
5 -
 6
6 -
 7
7 -
 8
8 -
 9
9 -
 10
10 -
 11
11 -
 12
12 -
 13
13 -
 14
14 -
 15
15 -
 16
16 -
 17
17 -
 18
18 -
 19
19 -
 20
20 -
 21
21 -
 22
22 -
 23
23 -
 24
24 -
 25
25 -
 26
26 -
 27
27 -
 28
28 -
 29
29 -
 30
30 -
 31
31 -
 32
32 -
 33
33 -
 34
34 -
 35
35 -
 36
36 -
 37
37 -
 38
38 -
 39
39 -
 40
40 -
 41
41 -
 42
42 -
 43
43 -
 44
44 -
 45
45 -
 46
46 -
 47
47 -
 48
48 -
 49
49 -
 50
50 -
 51
51 -
 52
52 -
 53
53 -
 54
54 -
 55
55 -
 56
56 -
 57
57 -
 58
58 -
 59
59 -
 60
60 -
 61
61 -
 62
62 -
 63
63 -
 64
64 -
 65
65 -
 66
66 -
 67
67 -
 68
68 -
 69
69 -
 70
70 -
 71
71 -
 72
72 -
 73
73 -
 74
74 -
 75
75 -
 76
76 -
 77
77 -
 78
78 -
 79
79 -
 80
80 -
 81
81 -
 82
82 -
 83
83 -
 84
84 -
 85
85 -
 86
86 -
 87
87 -
 88
88 -
 89
89 -
 90
90 -
 91
91 -
 92
92 -
 93
93 -
 94
94 -
 95
95 -
 96
96 -
 97
97 -
 98
98 -
 99
99 -
 100
100 -
 101
101 -
 102
102 -
 103
103 -
 104
104 -
 105
105 -
 106
106 -
 107
107 -
 108
108 -
 109
109 -
 110
110 -
 111
111 -
 112
112 -
 113
113 -
 114
114 -
 115
115 -
 116
116 -
 117
117 -
 118
118 -
 119
119 -
 120
120 -
 121
121 -
 122
122 -
 123
123 -
 124
124 -
 125
125 -
 126
126 -
 127
127 -
 128
128 -
 129
129 -
 130
130 -
 131
131 -
 132
132 -
 133
133 -
 134
134 -
 135
135 -
 136
136 -
 137
137 -
 138
138 -
 139
139 -
 140
140 -
 141
141 -
 142
142 -
 143
143 -
 144
144 -
 145
145 -
 146
146 -
 147
147 -
 148
148 -
 149
149 -
 150
150 -
 151
151 -
 152
152 -
 153
153 -
 154
154 -
 155
155 -
 156
156 -
 157
157 -
 158
158 -
 159
159 -
 160
160 -
 161
161 -
 162
162 -
 163
163 -
 164
164 -
 165
165 -
 166
166 -
 167
167 -
 168
168 -
 169
169 -
 170
170 -
 171
171 -
 172
172 -
 173
173 -
 174
174 -
 175
175 -
 176
176 -
 177
177 -
 178
178 -
 179
179 -
 180
180 -
 181
181 -
 182
182 -
 183
183 -
 184
184 -
 185
185 -
 186
186 -
 187
187 -
 188
188 -
 189
189 -
 190
190 -
 191
191 -
 192
192 -
 193
193 -
 194
194 -
 195
195 -
 196
196 -
 197
197 -
 198
198 -
 199
199 -
 200
200 -
 201
201 -
 202
202 -
 203
203 -
 204
204 -
 205
205 -
 206
206 -
 207
207 -
 208
208 -
 209
209 -
 210
210 -
 211
211 -
 212
212 -
 213
213 -
 214
214 -
 215
215 -
 216
216 -
 217
217 -
 218
218 -
 219
219 -
 220
220 -
 221
221 -
 222
222 -
 223
223 -
 224
224 -
 225
225 -
 226
226 -
 227
227 -
 228
228 -
 229
229 -
 230
230 -
 231
231 -
 232
232 -
 233
233 -
 234
234 -
 235
235 -
 236
236 -
 237
237 -
 238
238 -
 239
239 -
 240
240 -
 241
241 -
 242
242 -
 243
243 -
 244
244 -
 245
245 -
 246
246 -
 247
247 -
 248
248 -
 249
249 -
 250
250 -
 251
251 -
 252
252 -
 253
253 -
 254
254 -
 255
255 -
 256
256 -
 257
257 -
 258
258 -
 259
259 -
 260
260 -
 261
261 -
 262
262 -
 263
263 -
 264
264 -
 265
265 -
 266
266 -
 267
267 -
 268
268 -
 269
269 -
 270
270 -
 271
271 -
 272
272 -
 273
273 -
 274
274 -
 275
275 -
 276
276 -
 277
277 -
 278
278 -
 279
279 -
 280
280
 |
 |

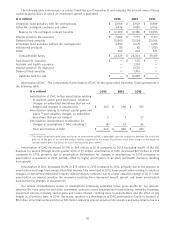
Within the equity portfolio, the losses were primarily concentrated in the energy, financial services and consumer
goods sectors. The unrealized losses were company and sector specific. As of December 31, 2014, we have the intent
and ability to hold our equity securities with unrealized losses until recovery.
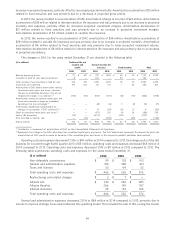
Global oil prices have declined significantly in recent months. Within the energy sector outlined above, we continue
to monitor the impact to our investment portfolio for those companies that may be adversely affected, both directly and
indirectly. If oil prices continue to decline or remain at depressed levels for an extended period, certain issuers and
investments may come under pressure.
Net investment income The following table presents net investment income for the years ended December 31.
($ in millions) 2014 2013 2012
Fixed income securities $ 2,447 $ 2,921 $ 3,234
Equity securities 117 149 127
Mortgage loans 265 372 374
Limited partnership interests 614 541 348
Short-term investments 7 5 6
Other 170 161 132
Investment income, before expense 3,620 4,149 4,221
Investment expense (161) (206) (211)
Net investment income $ 3,459 $ 3,943 $ 4,010
Net investment income decreased 12.3% or $484 million in 2014 compared to 2013, after decreasing 1.7% or
$67 million in 2013 compared to 2012. The 2014 decrease was primarily due to lower average investment balances
relating to the sale of LBL on April 1, 2014, lower fixed income yields and equity dividends, partially offset by higher
limited partnership income. Net investment income in 2014 includes $114 million related to prepayment fee income and
litigation proceeds compared to $139 million in 2013. These items may vary significantly from period to period and may
not recur. Higher EMA limited partnership income resulted from favorable equity and real estate valuations which
increased the carrying value of the partnerships. The 2013 decrease was primarily due to lower average investment
balances and lower fixed income yields, partially offset by higher limited partnership income and equity dividends, as
well as prepayment fee income and litigation proceeds which together increased 2013 income by a total of $68 million.
Realized capital gains and losses The following table presents the components of realized capital gains and
losses and the related tax effect for the years ended December 31.
($ in millions) 2014 2013 2012
Impairment write-downs $ (32) $ (72) $ (185)
Change in intent write-downs (213) (143) (48)
Net other-than-temporary impairment losses
recognized in earnings (245) (215) (233)
Sales 975 819 536
Valuation and settlements of derivative
instruments (36) (10) 24
Realized capital gains and losses, pre-tax 694 594 327
Income tax expense (243) (209) (111)
Realized capital gains and losses, after-tax $ 451 $ 385 $ 216
75
