Allstate 2014 Annual Report Download - page 165
Download and view the complete annual report
Please find page 165 of the 2014 Allstate annual report below. You can navigate through the pages in the report by either clicking on the pages listed below, or by using the keyword search tool below to find specific information within the annual report.-
 1
1 -
2
-
3
-
4
-
5
-
6
-
7
-
8
-
9
-
10
-
11
-
12
-
13
-
14
-
15
-
16
-
17
-
18
-
19
-
20
-
21
-
22
-
23
-
24
-
25
-
26
-
27
-
28
-
29
-
30
-
31
-
32
-
33
-
34
-
35
-
36
-
37
-
38
-
39
-
40
-
41
-
42
-
43
-
44
-
45
-
46
-
47
-
48
-
49
-
50
-
51
-
52
-
53
-
54
-
55
-
56
-
57
-
58
-
59
-
60
-
61
-
62
-
63
-
64
-
65
-
66
-
67
-
68
-
69
-
70
-
71
-
72
-
73
-
74
-
75
-
76
-
77
-
78
-
79
-
80
-
81
-
82
-
83
-
84
-
85
-
86
-
87
-
88
-
89
-
90
-
91
-
92
-
93
-
94
-
95
-
96
-
97
-
98
-
99
-
100
-
101
-
102
-
103
-
104
-
105
-
106
-
107
-
108
-
109
-
110
-
111
-
112
-
113
-
114
-
115
-
116
-
117
-
118
-
119
-
120
-
121
-
122
-
123
-
124
-
125
-
126
-
127
-
128
-
129
-
130
-
131
-
132
-
133
-
134
-
135
-
136
-
137
-
138
-
139
-
140
-
141
-
142
-
143
-
144
-
145
-
146
-
147
-
148
-
149
-
150
-
151
-
152
-
153
-
154
-
 155
155 -
 156
156 -
 157
157 -
 158
158 -
 159
159 -
 160
160 -
 161
161 -
 162
162 -
 163
163 -
 164
164 -
 165
165 -
 166
166 -
 167
167 -
 168
168 -
 169
169 -
 170
170 -
 171
171 -
 172
172 -
 173
173 -
 174
174 -
 175
175 -
176
-
177
-
178
-
179
-
180
-
181
-
182
-
183
-
184
-
185
-
186
-
187
-
188
-
189
-
190
-
191
-
192
-
193
-
194
-
195
-
196
-
197
-
198
-
199
-
200
-
201
-
202
-
203
-
204
-
205
-
206
-
207
-
208
-
209
-
210
-
211
-
212
-
213
-
214
-
215
-
216
-
217
-
218
-
219
-
220
-
221
-
222
-
223
-
224
-
225
-
226
-
227
-
228
-
229
-
230
-
231
-
232
-
233
-
234
-
235
-
236
-
237
-
238
-
239
-
240
-
241
-
242
-
243
-
244
-
245
-
246
-
247
-
248
-
249
-
250
-
251
-
252
-
253
-
254
-
255
-
256
-
257
-
258
-
259
-
260
-
261
-
262
-
263
-
264
-
265
-
266
-
267
-
268
-
269
-
270
-
271
-
272
-
273
-
274
-
275
-
276
-
277
-
278
-
279
-
280
 |
 |

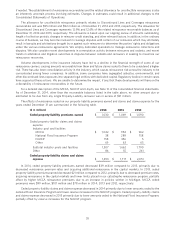
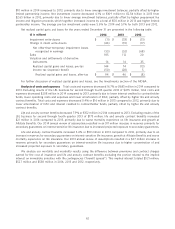
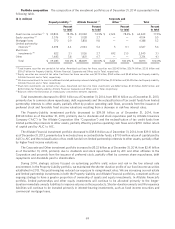
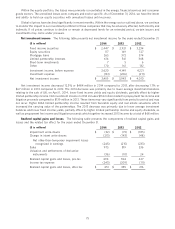
The following table summarizes our product liabilities as of December 31 and indicates the account value of those
contracts and policies in which an investment spread is generated.
($ in millions) 2014 2013 2012
Immediate fixed annuities with life contingencies $ 8,904 $ 8,928 $ 8,889
Other life contingent contracts and other 3,476 3,458 6,006
Reserve for life-contingent contract benefits $ 12,380 $ 12,386 $ 14,895
Interest-sensitive life insurance $ 7,880 $ 7,777 $ 11,011
Deferred fixed annuities 10,860 12,524 22,066
Immediate fixed annuities without life contingencies 3,450 3,675 3,815
Institutional products 85 85 1,851
Other 254 243 576
Contractholder funds $ 22,529 $ 24,304 $ 39,319
Traditional life insurance $ — $ 570 $ —
Accident and health insurance — 1,324 —
Interest-sensitive life insurance — 3,529 —
Deferred fixed annuities — 7,416 —
Liabilities held for sale $ — $ 12,839 $ —
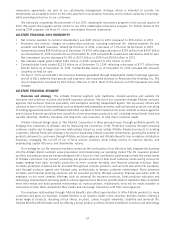
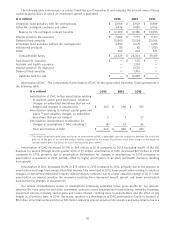
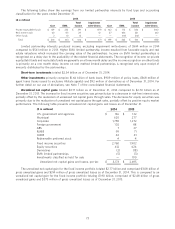
Amortization of DAC The components of amortization of DAC for the years ended December 31 are summarized in
the following table.
($ in millions) 2014 2013 2012
Amortization of DAC before amortization relating
to realized capital gains and losses, valuation
changes on embedded derivatives that are not
hedged and changes in assumptions $ 263 $ 298 $ 310
Amortization relating to realized capital gains and
losses (1) and valuation changes on embedded
derivatives that are not hedged 5 7 57
Amortization (deceleration) acceleration for
changes in assumptions (‘‘DAC unlocking’’) (8) 23 34
Total amortization of DAC $ 260 $ 328 $ 401
(1) The impact of realized capital gains and losses on amortization of DAC is dependent upon the relationship between the assets that
give rise to the gain or loss and the product liability supported by the assets. Fluctuations result from changes in the impact of
realized capital gains and losses on actual and expected gross profits.
Amortization of DAC decreased 20.7% or $68 million in 2014 compared to 2013. Excluding results of the LBL
business for second through fourth quarter 2013 of $1 million, amortization of DAC decreased $67 million in 2014
compared to 2013, primarily due to amortization deceleration for changes in assumptions in 2014 compared to
amortization acceleration in 2013, partially offset by higher amortization on accident and health insurance resulting
from growth.
Amortization of DAC decreased 18.2% or $73 million in 2013 compared to 2012, primarily due to the absence of
amortization on a large fixed annuity block that became fully amortized in 2012, lower amortization relating to valuation
changes on derivatives embedded in equity-indexed annuity contracts due to a large valuation change in 2012, lower
amortization on interest-sensitive life insurance resulting from decreased benefit spread, and lower amortization
acceleration for changes in assumptions.
Our annual comprehensive review of assumptions underlying estimated future gross profits for our interest-
sensitive life, fixed annuities and other investment contracts covers assumptions for persistency, mortality, expenses,
investment returns, including capital gains and losses, interest crediting rates to policyholders, and the effect of any
hedges in all product lines. In 2014, the review resulted in a deceleration of DAC amortization (credit to income) of
$8 million. Amortization deceleration of $10 million related to interest-sensitive life insurance and was primarily due to a
65