Allstate 2014 Annual Report Download - page 61
Download and view the complete annual report
Please find page 61 of the 2014 Allstate annual report below. You can navigate through the pages in the report by either clicking on the pages listed below, or by using the keyword search tool below to find specific information within the annual report.-
 1
1 -
2
-
3
-
4
-
5
-
6
-
7
-
8
-
9
-
10
-
11
-
12
-
13
-
14
-
15
-
16
-
17
-
18
-
19
-
20
-
21
-
22
-
23
-
24
-
25
-
26
-
27
-
28
-
29
-
30
-
31
-
32
-
33
-
34
-
35
-
36
-
37
-
38
-
39
-
40
-
41
-
42
-
43
-
44
-
45
-
46
-
47
-
48
-
49
-
50
-
 51
51 -
 52
52 -
 53
53 -
 54
54 -
 55
55 -
 56
56 -
 57
57 -
 58
58 -
 59
59 -
 60
60 -
 61
61 -
 62
62 -
 63
63 -
 64
64 -
 65
65 -
 66
66 -
 67
67 -
 68
68 -
 69
69 -
 70
70 -
 71
71 -
72
-
73
-
74
-
75
-
76
-
77
-
78
-
79
-
80
-
81
-
82
-
83
-
84
-
85
-
86
-
87
-
88
-
89
-
90
-
91
-
92
-
93
-
94
-
95
-
96
-
97
-
98
-
99
-
100
-
101
-
102
-
103
-
104
-
105
-
106
-
107
-
108
-
109
-
110
-
111
-
112
-
113
-
114
-
115
-
116
-
117
-
118
-
119
-
120
-
121
-
122
-
123
-
124
-
125
-
126
-
127
-
128
-
129
-
130
-
131
-
132
-
133
-
134
-
135
-
136
-
137
-
138
-
139
-
140
-
141
-
142
-
143
-
144
-
145
-
146
-
147
-
148
-
149
-
150
-
151
-
152
-
153
-
154
-
155
-
156
-
157
-
158
-
159
-
160
-
161
-
162
-
163
-
164
-
165
-
166
-
167
-
168
-
169
-
170
-
171
-
172
-
173
-
174
-
175
-
176
-
177
-
178
-
179
-
180
-
181
-
182
-
183
-
184
-
185
-
186
-
187
-
188
-
189
-
190
-
191
-
192
-
193
-
194
-
195
-
196
-
197
-
198
-
199
-
200
-
201
-
202
-
203
-
204
-
205
-
206
-
207
-
208
-
209
-
210
-
211
-
212
-
213
-
214
-
215
-
216
-
217
-
218
-
219
-
220
-
221
-
222
-
223
-
224
-
225
-
226
-
227
-
228
-
229
-
230
-
231
-
232
-
233
-
234
-
235
-
236
-
237
-
238
-
239
-
240
-
241
-
242
-
243
-
244
-
245
-
246
-
247
-
248
-
249
-
250
-
251
-
252
-
253
-
254
-
255
-
256
-
257
-
258
-
259
-
260
-
261
-
262
-
263
-
264
-
265
-
266
-
267
-
268
-
269
-
270
-
271
-
272
-
273
-
274
-
275
-
276
-
277
-
278
-
279
-
280
 |
 |

9MAR201204034531
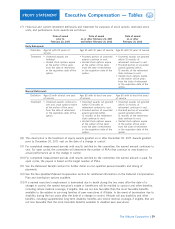
Executive Compensation — Tables
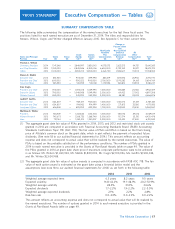
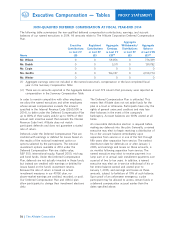
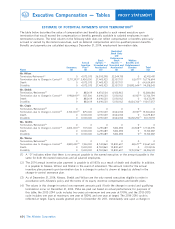
OUTSTANDING EQUITY AWARDS AT FISCAL YEAR-END 2014
The following table summarizes the outstanding equity awards of the named executives as of December 31, 2014.
Option Awards(1) Stock Awards(2)
Mr. Wilson 06/01/2005 100,000 0 $58.47 06/01/2015
02/21/2006 66,000 0 $53.84 02/21/2016
02/21/2006 124,000 0 $53.84 02/21/2016
02/20/2007 262,335 0 $62.24 02/20/2017
02/26/2008 338,316 0 $48.82 02/26/2018
02/22/2010 417,576 0 $31.41 02/22/2020
02/22/2011 335,856 111,952 $31.74 02/22/2021 02/22/2011 18,195 $1,278,199
02/21/2012 222,030 222,030 $31.56 02/21/2022 03/06/2012 244,248 $17,158,422
02/12/2013 0 363,409 $45.61 02/12/2023 02/12/2013 106,921 $7,511,200 28,137 $1,976,624
02/18/2014 0 309,237 $52.18 02/18/2024 02/18/2014 73,783 $5,183,256
Mr. Shebik 02/21/2006 15,464 0 $53.84 02/21/2016
02/21/2006 9,000 0 $53.84 02/21/2016
02/20/2007 15,571 0 $62.24 02/20/2017
02/26/2008 25,763 0 $48.82 02/26/2018
02/27/2009 38,715 0 $16.83 02/27/2019
02/22/2010 33,616 0 $31.41 02/22/2020
02/22/2011 26,397 8,800 $31.74 02/22/2021 02/22/2011 886 $62,242
02/21/2012 13,223 13,223 $31.56 02/21/2022 02/21/2012 3,633 $255,218
03/06/2012 17,507 17,507 $31.00 03/06/2022 03/06/2012 19,147 $1,345,077
02/12/2013 0 75,188 $45.61 02/12/2023 02/12/2013 24,994 $1,755,829 6,578 $462,104
02/18/2014 0 72,289 $52.18 02/18/2024 02/18/2014 17,248 $1,211,672
Mr. Civgin 09/08/2008 65,000 0 $46.48 09/08/2018
02/22/2010 111,944 0 $31.41 02/22/2020
02/22/2011 86,508 28,836 $31.74 02/22/2021 02/22/2011 4,687 $329,262
02/21/2012 54,786 54,787 $31.56 02/21/2022 03/06/2012 60,269 $4,233,897
02/12/2013 0 87,719 $45.61 02/12/2023 02/12/2013 29,159 $2,048,420 7,674 $539,098
02/18/2014 0 84,337 $52.18 02/18/2024 02/18/2014 20,123 $1,413,641
Ms. Greffin 02/21/2006 19,919 0 $53.84 02/21/2016
02/21/2006 4,723 0 $53.84 02/21/2016
02/20/2007 21,291 0 $62.24 02/20/2017
02/20/2007 4,854 0 $62.24 02/20/2017
07/17/2007 3,660 0 $60.42 07/17/2017
02/26/2008 68,365 0 $48.82 02/26/2018
02/26/2008 28,298 0 $48.82 02/26/2018
08/11/2008 14,250 0 $46.56 08/11/2018
02/27/2009 36,911 0 $16.83 02/27/2019
02/22/2010 91,088 0 $31.41 02/22/2020
02/22/2011 77,857 25,953 $31.74 02/22/2021 02/22/2011 4,218 $296,315
02/21/2012 51,903 51,903 $31.56 02/21/2022 03/06/2012 57,096 $4,010,994
02/12/2013 0 76,441 $45.61 02/12/2023 02/12/2013 25,411 $1,785,123 6,687 $469,762
02/18/2014 0 77,510 $52.18 02/18/2024 02/18/2014 18,494 $1,299,204
Mr. Winter 11/02/2009 8,385 0 $29.64 11/02/2019
02/22/2011 111,951 37,318 $31.74 02/22/2021 02/22/2011 6,065 $426,066
02/21/2012 72,087 72,088 $31.56 02/21/2022 03/06/2012 79,302 $5,570,966
02/12/2013 0 105,994 $45.61 02/12/2023 02/12/2013 35,234 $2,475,189 9,273 $651,428
02/18/2014 0 105,422 $52.18 02/18/2024 02/18/2014 25,153 $1,766,998
(1) The options granted in 2014 vest over three years: one-third will become exercisable on the anniversary of
the grant date for each of the three years. The options granted in 2013, 2012, 2011, and 2010 vest over four
years: 50% on the second anniversary date and 25% on each of the third and fourth anniversary dates. The
other options vest in four installments of 25% on each of the first four anniversaries of the grant date. The
exercise price of each option is equal to the closing price of Allstate’s common stock on the grant date. For
options granted prior to 2007, fair market value is equal to the average of the high and low sale prices on
the grant date. For options granted in 2007 and thereafter, fair market value is equal to the closing sale price
on the grant date. In each case, if there was no sale on the grant date, the closing price is calculated as of
the last previous day on which there was a sale.
51
PROXY STATEMENT
Equity
Incentive Equity
Plan Incentive
Awards: Plan
Number of Awards
Unearned Market or
Shares, Payout Value
Number of Number of Number of Units, or of Unearned
Securities Securities Shares or Market Value Other Shares, Units,
Underlying Underlying Option Units of of Shares or Rights or Other
Unexercised Unexercised Exercise Option Stock That Units of Stock that Have Rights that
Option Grant Options (#) Options (#) Price Expiration Stock Award Have Not That Have Not Not Have Not
Name Date Exercisable(3) Unexercisable(3) ($) Date Grant Date Vested (#)(4) Vested ($)(5) Vested (#)(6) Vested ($)(5)
The Allstate Corporation