Allstate 2014 Annual Report Download - page 38
Download and view the complete annual report
Please find page 38 of the 2014 Allstate annual report below. You can navigate through the pages in the report by either clicking on the pages listed below, or by using the keyword search tool below to find specific information within the annual report.-
 1
1 -
2
-
3
-
4
-
5
-
6
-
7
-
8
-
9
-
10
-
11
-
12
-
13
-
14
-
15
-
16
-
17
-
18
-
19
-
20
-
21
-
22
-
23
-
24
-
25
-
26
-
27
-
 28
28 -
 29
29 -
 30
30 -
 31
31 -
 32
32 -
 33
33 -
 34
34 -
 35
35 -
 36
36 -
 37
37 -
 38
38 -
 39
39 -
 40
40 -
 41
41 -
 42
42 -
 43
43 -
 44
44 -
 45
45 -
 46
46 -
 47
47 -
 48
48 -
49
-
50
-
51
-
52
-
53
-
54
-
55
-
56
-
57
-
58
-
59
-
60
-
61
-
62
-
63
-
64
-
65
-
66
-
67
-
68
-
69
-
70
-
71
-
72
-
73
-
74
-
75
-
76
-
77
-
78
-
79
-
80
-
81
-
82
-
83
-
84
-
85
-
86
-
87
-
88
-
89
-
90
-
91
-
92
-
93
-
94
-
95
-
96
-
97
-
98
-
99
-
100
-
101
-
102
-
103
-
104
-
105
-
106
-
107
-
108
-
109
-
110
-
111
-
112
-
113
-
114
-
115
-
116
-
117
-
118
-
119
-
120
-
121
-
122
-
123
-
124
-
125
-
126
-
127
-
128
-
129
-
130
-
131
-
132
-
133
-
134
-
135
-
136
-
137
-
138
-
139
-
140
-
141
-
142
-
143
-
144
-
145
-
146
-
147
-
148
-
149
-
150
-
151
-
152
-
153
-
154
-
155
-
156
-
157
-
158
-
159
-
160
-
161
-
162
-
163
-
164
-
165
-
166
-
167
-
168
-
169
-
170
-
171
-
172
-
173
-
174
-
175
-
176
-
177
-
178
-
179
-
180
-
181
-
182
-
183
-
184
-
185
-
186
-
187
-
188
-
189
-
190
-
191
-
192
-
193
-
194
-
195
-
196
-
197
-
198
-
199
-
200
-
201
-
202
-
203
-
204
-
205
-
206
-
207
-
208
-
209
-
210
-
211
-
212
-
213
-
214
-
215
-
216
-
217
-
218
-
219
-
220
-
221
-
222
-
223
-
224
-
225
-
226
-
227
-
228
-
229
-
230
-
231
-
232
-
233
-
234
-
235
-
236
-
237
-
238
-
239
-
240
-
241
-
242
-
243
-
244
-
245
-
246
-
247
-
248
-
249
-
250
-
251
-
252
-
253
-
254
-
255
-
256
-
257
-
258
-
259
-
260
-
261
-
262
-
263
-
264
-
265
-
266
-
267
-
268
-
269
-
270
-
271
-
272
-
273
-
274
-
275
-
276
-
277
-
278
-
279
-
280
 |
 |

9MAR201204034531
19MAR201514590205
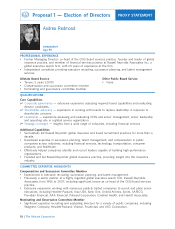
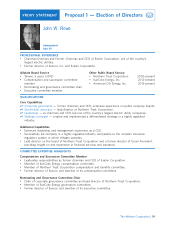
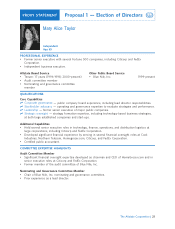
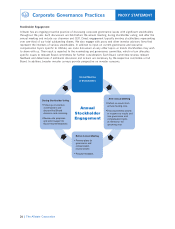
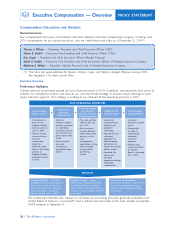
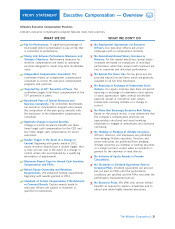
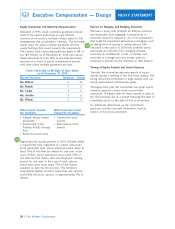
Executive Compensation — Overview
Compensation Discussion and Analysis
Named Executives
Our Compensation Discussion and Analysis describes Allstate’s executive compensation program, including total
2014 compensation for our named executives, who are listed below with titles as of December 31, 2014(1):
Thomas J. Wilson — Chairman, President and Chief Executive Officer (CEO)
Steven E. Shebik — Executive Vice President and Chief Financial Officer (CFO)
Don Civgin — President and Chief Executive Officer, Allstate Financial
Judith P. Greffin — Executive Vice President and Chief Investment Officer of Allstate Insurance Company
Matthew E. Winter — President, Allstate Personal Lines of Allstate Insurance Company
(1) The titles and responsibilities for Messrs. Wilson, Civgin, and Winter changed effective January 2015.
See Appendix C for their current titles.
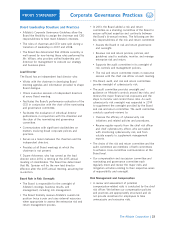
Executive Overview
Performance Highlights
Allstate achieved broad-based growth and solid financial results in 2014. In addition, we proactively took action to
enhance our competitive position and execute our customer-driven strategy to provide unique offerings to each
major customer segment. This strategy is working as we achieved all five operating priorities in 2014:
++++
• Total policies in • Allstate’s • The total portfolio • Invested in • Increased
force for the Property-Liability yield for the year integrated data, Esurance’s market
Property-Liability business produced was 4.5%. analytics and share.
business grew by an underlying advanced
• Net investment • Strategically
2.5% in 2014. combined ratio for technology.
income reflected invested in
2014 of 87.2 (0.1
• Policies in force solid fixed income • Focused life and usage-based
points better than
increased across earnings in line retirement telematics
2013).
all three with operations on insurance
underwritten • Allstate brand management’s Allstate agency programs.
brands by auto and expectations, along distribution to • New business
840,000, which homeowners with continued further our trusted written premiums
led to a $1.5 billion generated strong strong limited advisor model. for Allstate
increase in returns. partnership • Improved the Benefits increased
Property-Liability results. agency and 5% in 2014.
premiums written customer
in 2014. experience through
technology
simplification.
RESULTS
* The underlying combined ratio measure is not based on accounting principles generally accepted in the
United States of America (‘‘non-GAAP’’) and is defined and reconciled to the most directly comparable
GAAP measure in Appendix D.
28
PROXY STATEMENT
The Allstate Corporation
2014 OPERATING PRIORITIES
Proactively manage
Maintain the
Grow insurance investments to Modernize the Build long-term
underlying
policies in force generate attractive operating model growth platforms
combined ratio* risk-adjusted returns
Strong profitability — net income Financial strength — repaid Cash return to stockholders —
available to common stockholders in $950 million of maturing debt and provided $2.78 billion in cash returns
2014 of $2.75 billion, or $6.27 per issued $998 million of preferred to common stockholders through
diluted common share, compared stock in 2014, which decreased ratio common stock dividends and share
with $2.26 billion, or $4.81 per of debt to capital resources to 18.9% repurchases
diluted common share in 2013 at year-end