Allstate 2014 Annual Report Download - page 218
Download and view the complete annual report
Please find page 218 of the 2014 Allstate annual report below. You can navigate through the pages in the report by either clicking on the pages listed below, or by using the keyword search tool below to find specific information within the annual report.-
 1
1 -
2
-
3
-
4
-
5
-
6
-
7
-
8
-
9
-
10
-
11
-
12
-
13
-
14
-
15
-
16
-
17
-
18
-
19
-
20
-
21
-
22
-
23
-
24
-
25
-
26
-
27
-
28
-
29
-
30
-
31
-
32
-
33
-
34
-
35
-
36
-
37
-
38
-
39
-
40
-
41
-
42
-
43
-
44
-
45
-
46
-
47
-
48
-
49
-
50
-
51
-
52
-
53
-
54
-
55
-
56
-
57
-
58
-
59
-
60
-
61
-
62
-
63
-
64
-
65
-
66
-
67
-
68
-
69
-
70
-
71
-
72
-
73
-
74
-
75
-
76
-
77
-
78
-
79
-
80
-
81
-
82
-
83
-
84
-
85
-
86
-
87
-
88
-
89
-
90
-
91
-
92
-
93
-
94
-
95
-
96
-
97
-
98
-
99
-
100
-
101
-
102
-
103
-
104
-
105
-
106
-
107
-
108
-
109
-
110
-
111
-
112
-
113
-
114
-
115
-
116
-
117
-
118
-
119
-
120
-
121
-
122
-
123
-
124
-
125
-
126
-
127
-
128
-
129
-
130
-
131
-
132
-
133
-
134
-
135
-
136
-
137
-
138
-
139
-
140
-
141
-
142
-
143
-
144
-
145
-
146
-
147
-
148
-
149
-
150
-
151
-
152
-
153
-
154
-
155
-
156
-
157
-
158
-
159
-
160
-
161
-
162
-
163
-
164
-
165
-
166
-
167
-
168
-
169
-
170
-
171
-
172
-
173
-
174
-
175
-
176
-
177
-
178
-
179
-
180
-
181
-
182
-
183
-
184
-
185
-
186
-
187
-
188
-
189
-
190
-
191
-
192
-
193
-
194
-
195
-
196
-
197
-
198
-
199
-
200
-
201
-
202
-
203
-
204
-
205
-
206
-
207
-
 208
208 -
 209
209 -
 210
210 -
 211
211 -
 212
212 -
 213
213 -
 214
214 -
 215
215 -
 216
216 -
 217
217 -
 218
218 -
 219
219 -
 220
220 -
 221
221 -
 222
222 -
 223
223 -
 224
224 -
 225
225 -
 226
226 -
 227
227 -
 228
228 -
229
-
230
-
231
-
232
-
233
-
234
-
235
-
236
-
237
-
238
-
239
-
240
-
241
-
242
-
243
-
244
-
245
-
246
-
247
-
248
-
249
-
250
-
251
-
252
-
253
-
254
-
255
-
256
-
257
-
258
-
259
-
260
-
261
-
262
-
263
-
264
-
265
-
266
-
267
-
268
-
269
-
270
-
271
-
272
-
273
-
274
-
275
-
276
-
277
-
278
-
279
-
280
 |
 |
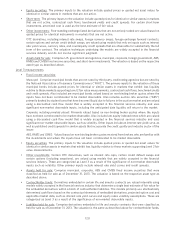
inputs be used when available. Assets and liabilities recorded on the Consolidated Statements of Financial Position at
fair value are categorized in the fair value hierarchy based on the observability of inputs to the valuation techniques as
follows:
Level 1: Assets and liabilities whose values are based on unadjusted quoted prices for identical assets or liabilities
in an active market that the Company can access.
Level 2: Assets and liabilities whose values are based on the following:
(a) Quoted prices for similar assets or liabilities in active markets;
(b) Quoted prices for identical or similar assets or liabilities in markets that are not active; or
(c) Valuation models whose inputs are observable, directly or indirectly, for substantially the full term of
the asset or liability.
Level 3: Assets and liabilities whose values are based on prices or valuation techniques that require inputs that
are both unobservable and significant to the overall fair value measurement. Unobservable inputs reflect
the Company’s estimates of the assumptions that market participants would use in valuing the assets and
liabilities.
The availability of observable inputs varies by instrument. In situations where fair value is based on internally
developed pricing models or inputs that are unobservable in the market, the determination of fair value requires more
judgment. The degree of judgment exercised by the Company in determining fair value is typically greatest for
instruments categorized in Level 3. In many instances, valuation inputs used to measure fair value fall into different
levels of the fair value hierarchy. The category level in the fair value hierarchy is determined based on the lowest level
input that is significant to the fair value measurement in its entirety. The Company uses prices and inputs that are
current as of the measurement date, including during periods of market disruption. In periods of market disruption, the
ability to observe prices and inputs may be reduced for many instruments.
The Company is responsible for the determination of fair value and the supporting assumptions and methodologies.
The Company gains assurance that assets and liabilities are appropriately valued through the execution of various
processes and controls designed to ensure the overall reasonableness and consistent application of valuation
methodologies, including inputs and assumptions, and compliance with accounting standards. For fair values received
from third parties or internally estimated, the Company’s processes and controls are designed to ensure that the
valuation methodologies are appropriate and consistently applied, the inputs and assumptions are reasonable and
consistent with the objective of determining fair value, and the fair values are accurately recorded. For example, on a
continuing basis, the Company assesses the reasonableness of individual fair values that have stale security prices or
that exceed certain thresholds as compared to previous fair values received from valuation service providers or brokers
or derived from internal models. The Company performs procedures to understand and assess the methodologies,
processes and controls of valuation service providers. In addition, the Company may validate the reasonableness of fair
values by comparing information obtained from valuation service providers or brokers to other third party valuation
sources for selected securities. The Company performs ongoing price validation procedures such as back-testing of
actual sales, which corroborate the various inputs used in internal models to market observable data. When fair value
determinations are expected to be more variable, the Company validates them through reviews by members of
management who have relevant expertise and who are independent of those charged with executing investment
transactions.
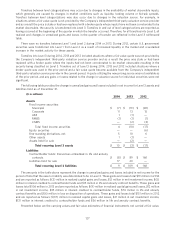
The Company has two types of situations where investments are classified as Level 3 in the fair value hierarchy. The
first is where specific inputs significant to the fair value estimation models are not market observable. This primarily
occurs in the Company’s use of broker quotes to value certain securities where the inputs have not been corroborated to
be market observable, and the use of valuation models that use significant non-market observable inputs.
The second situation where the Company classifies securities in Level 3 is where quotes continue to be received
from independent third-party valuation service providers and all significant inputs are market observable; however, there
has been a significant decrease in the volume and level of activity for the asset when compared to normal market
activity such that the degree of market observability has declined to a point where categorization as a Level 3
measurement is considered appropriate. The indicators considered in determining whether a significant decrease in the
volume and level of activity for a specific asset has occurred include the level of new issuances in the primary market,
trading volume in the secondary market, the level of credit spreads over historical levels, applicable bid-ask spreads, and
price consensus among market participants and other pricing sources.
118