Allstate 2014 Annual Report Download - page 271
Download and view the complete annual report
Please find page 271 of the 2014 Allstate annual report below. You can navigate through the pages in the report by either clicking on the pages listed below, or by using the keyword search tool below to find specific information within the annual report.-
 1
1 -
2
-
3
-
4
-
5
-
6
-
7
-
8
-
9
-
10
-
11
-
12
-
13
-
14
-
15
-
16
-
17
-
18
-
19
-
20
-
21
-
22
-
23
-
24
-
25
-
26
-
27
-
28
-
29
-
30
-
31
-
32
-
33
-
34
-
35
-
36
-
37
-
38
-
39
-
40
-
41
-
42
-
43
-
44
-
45
-
46
-
47
-
48
-
49
-
50
-
51
-
52
-
53
-
54
-
55
-
56
-
57
-
58
-
59
-
60
-
61
-
62
-
63
-
64
-
65
-
66
-
67
-
68
-
69
-
70
-
71
-
72
-
73
-
74
-
75
-
76
-
77
-
78
-
79
-
80
-
81
-
82
-
83
-
84
-
85
-
86
-
87
-
88
-
89
-
90
-
91
-
92
-
93
-
94
-
95
-
96
-
97
-
98
-
99
-
100
-
101
-
102
-
103
-
104
-
105
-
106
-
107
-
108
-
109
-
110
-
111
-
112
-
113
-
114
-
115
-
116
-
117
-
118
-
119
-
120
-
121
-
122
-
123
-
124
-
125
-
126
-
127
-
128
-
129
-
130
-
131
-
132
-
133
-
134
-
135
-
136
-
137
-
138
-
139
-
140
-
141
-
142
-
143
-
144
-
145
-
146
-
147
-
148
-
149
-
150
-
151
-
152
-
153
-
154
-
155
-
156
-
157
-
158
-
159
-
160
-
161
-
162
-
163
-
164
-
165
-
166
-
167
-
168
-
169
-
170
-
171
-
172
-
173
-
174
-
175
-
176
-
177
-
178
-
179
-
180
-
181
-
182
-
183
-
184
-
185
-
186
-
187
-
188
-
189
-
190
-
191
-
192
-
193
-
194
-
195
-
196
-
197
-
198
-
199
-
200
-
201
-
202
-
203
-
204
-
205
-
206
-
207
-
208
-
209
-
210
-
211
-
212
-
213
-
214
-
215
-
216
-
217
-
218
-
219
-
220
-
221
-
222
-
223
-
224
-
225
-
226
-
227
-
228
-
229
-
230
-
231
-
232
-
233
-
234
-
235
-
236
-
237
-
238
-
239
-
240
-
241
-
242
-
243
-
244
-
245
-
246
-
247
-
248
-
249
-
250
-
251
-
252
-
253
-
254
-
255
-
256
-
257
-
258
-
259
-
260
-
 261
261 -
 262
262 -
 263
263 -
 264
264 -
 265
265 -
 266
266 -
 267
267 -
 268
268 -
 269
269 -
 270
270 -
 271
271 -
 272
272 -
 273
273 -
 274
274 -
 275
275 -
 276
276 -
 277
277 -
 278
278 -
 279
279 -
 280
280
 |
 |

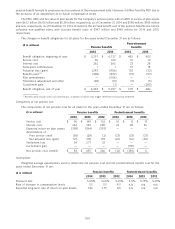
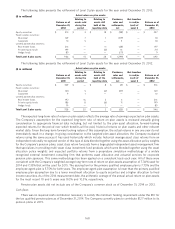
A summary of option activity for the year ended December 31, 2014 is shown in the following table.
Weighted
Weighted Aggregate average
average intrinsic remaining
Number exercise value contractual
(in 000s) price (in 000s) term (years)
Outstanding as of January 1, 2014 23,982 $ 40.60
Granted 2,499 52.43
Exercised (7,750) 40.55
Forfeited (535) 41.67
Expired (207) 56.44
Outstanding as of December 31, 2014 17,989 42.05 $ 507,227 5.4
Outstanding, net of expected forfeitures 17,856 42.02 504,113 5.4
Outstanding, exercisable (‘‘vested’’) 10,872 41.19 315,929 3.8
The weighted average grant date fair value of options granted was $12.50, $11.99 and $8.69 during 2014, 2013 and
2012, respectively. The intrinsic value, which is the difference between the fair value and the exercise price, of options
exercised was $151 million, $92 million and $52 million during 2014, 2013 and 2012, respectively.
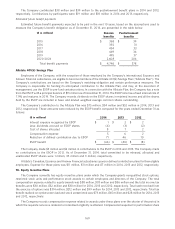
The changes in restricted stock units are shown in the following table for the year ended December 31, 2014.
Weighted
average
Number grant date
(in 000s) fair value
Nonvested as of January 1, 2014 2,840 $ 35.89
Granted 755 52.70
Vested (1,098) 32.07
Forfeited (217) 42.46
Nonvested as of December 31, 2014 2,280 42.71
The fair value of restricted stock units is based on the market value of the Company’s stock as of the date of the
grant. The market value in part reflects the payment of future dividends expected. The weighted average grant date fair
value of restricted stock units granted was $52.70, $45.78 and $31.89 during 2014, 2013 and 2012, respectively. The
total fair value of restricted stock units vested was $60 million, $104 million and $30 million during 2014, 2013 and
2012, respectively.
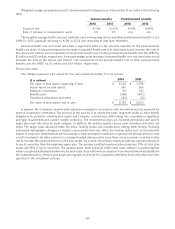
The changes in performance stock awards are shown in the following table for the year ended December 31, 2014.
Weighted
average
Number grant date
(in 000s) fair value
Nonvested as of January 1, 2014 843 $ 36.38
Granted 259 52.18
Adjustment for performance achievement 240 37.35
Vested — —
Forfeited (38) 36.41
Nonvested as of December 31, 2014 1,304 39.70
The increase in PSA’s comprises the granted which is at the targeted payout and the adjustment to the granted for
performance achievement. The fair value of performance stock awards is based on the market value of the Company’s
stock as of the date of the grant. The market value in part reflects the payment of future dividends expected. The
weighted average grant date fair value of performance stock awards granted was $52.18, $45.61 and $31.41 during 2014,
2013 and 2012, respectively. None of the performance stock awards vested during 2014, 2013 or 2012.
171