Allstate 2014 Annual Report Download - page 141
Download and view the complete annual report
Please find page 141 of the 2014 Allstate annual report below. You can navigate through the pages in the report by either clicking on the pages listed below, or by using the keyword search tool below to find specific information within the annual report.-
 1
1 -
2
-
3
-
4
-
5
-
6
-
7
-
8
-
9
-
10
-
11
-
12
-
13
-
14
-
15
-
16
-
17
-
18
-
19
-
20
-
21
-
22
-
23
-
24
-
25
-
26
-
27
-
28
-
29
-
30
-
31
-
32
-
33
-
34
-
35
-
36
-
37
-
38
-
39
-
40
-
41
-
42
-
43
-
44
-
45
-
46
-
47
-
48
-
49
-
50
-
51
-
52
-
53
-
54
-
55
-
56
-
57
-
58
-
59
-
60
-
61
-
62
-
63
-
64
-
65
-
66
-
67
-
68
-
69
-
70
-
71
-
72
-
73
-
74
-
75
-
76
-
77
-
78
-
79
-
80
-
81
-
82
-
83
-
84
-
85
-
86
-
87
-
88
-
89
-
90
-
91
-
92
-
93
-
94
-
95
-
96
-
97
-
98
-
99
-
100
-
101
-
102
-
103
-
104
-
105
-
106
-
107
-
108
-
109
-
110
-
111
-
112
-
113
-
114
-
115
-
116
-
117
-
118
-
119
-
120
-
121
-
122
-
123
-
124
-
125
-
126
-
127
-
128
-
129
-
130
-
 131
131 -
 132
132 -
 133
133 -
 134
134 -
 135
135 -
 136
136 -
 137
137 -
 138
138 -
 139
139 -
 140
140 -
 141
141 -
 142
142 -
 143
143 -
 144
144 -
 145
145 -
 146
146 -
 147
147 -
 148
148 -
 149
149 -
 150
150 -
 151
151 -
152
-
153
-
154
-
155
-
156
-
157
-
158
-
159
-
160
-
161
-
162
-
163
-
164
-
165
-
166
-
167
-
168
-
169
-
170
-
171
-
172
-
173
-
174
-
175
-
176
-
177
-
178
-
179
-
180
-
181
-
182
-
183
-
184
-
185
-
186
-
187
-
188
-
189
-
190
-
191
-
192
-
193
-
194
-
195
-
196
-
197
-
198
-
199
-
200
-
201
-
202
-
203
-
204
-
205
-
206
-
207
-
208
-
209
-
210
-
211
-
212
-
213
-
214
-
215
-
216
-
217
-
218
-
219
-
220
-
221
-
222
-
223
-
224
-
225
-
226
-
227
-
228
-
229
-
230
-
231
-
232
-
233
-
234
-
235
-
236
-
237
-
238
-
239
-
240
-
241
-
242
-
243
-
244
-
245
-
246
-
247
-
248
-
249
-
250
-
251
-
252
-
253
-
254
-
255
-
256
-
257
-
258
-
259
-
260
-
261
-
262
-
263
-
264
-
265
-
266
-
267
-
268
-
269
-
270
-
271
-
272
-
273
-
274
-
275
-
276
-
277
-
278
-
279
-
280
 |
 |

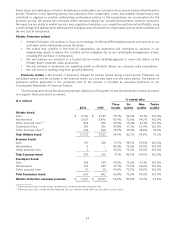
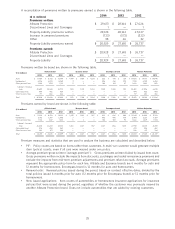
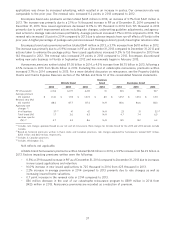
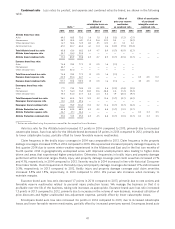
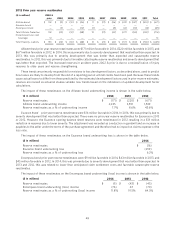
Combined ratio Loss ratios by product, and expense and combined ratios by brand, are shown in the following
table.
Effect of Effect of amortization
Effect of prior year reserve of purchased
catastrophe losses on reestimates intangible assets on
Ratio (1) combined ratio on combined ratio combined ratio
2014 2013 2012 2014 2013 2012 2014 2013 2012 2014 2013 2012
Allstate brand loss ratio:
Auto 69.2 68.5 70.3 1.6 1.0 3.8 (1.2) (1.2) (2.1)
Homeowners 58.7 53.4 64.1 21.4 15.6 23.2 0.4 — (5.2)
Other personal lines 61.7 58.6 72.3 8.2 3.5 12.3 2.1 1.8 2.2
Commercial lines 67.0 60.7 60.4 6.1 0.4 0.6 (4.2) (7.9) (10.4)
Total Allstate brand loss ratio 65.8 63.6 68.3 6.9 4.7 8.9 (0.7) (0.9) (2.7)
Allstate brand expense ratio 25.7 26.3 25.5 — — — — — — — — —
Allstate brand combined ratio 91.5 89.9 93.8 6.9 4.7 8.9 (0.7) (0.9) (2.7) — — —
Esurance brand loss ratio:
Auto 76.8 78.5 77.2 1.3 0.9 1.6 (1.1) — —
Homeowners 66.7 — — — — — — — —
Other personal lines 60.0 50.0 — — — — — — —
Total Esurance brand loss ratio 76.8 78.5 77.2 1.3 0.9 1.6 (1.1) — —
Esurance brand expense ratio 40.9 39.0 42.7 — — — — — — 3.3 4.9 10.1
Esurance brand combined ratio 117.7 117.5 119.9 1.3 0.9 1.6 (1.1) — — 3.3 4.9 10.1
Encompass brand loss ratio:
Auto 77.1 73.5 78.5 3.2 0.3 3.6 (2.0) (4.8) (3.9)
Homeowners 74.7 56.3 76.5 28.2 12.6 28.8 0.4 (1.2) (3.2)
Other personal lines 75.5 54.0 67.7 6.6 4.0 5.4 1.9 (8.0) (9.7)
Total Encompass brand loss ratio 76.0 65.4 76.9 13.2 5.2 12.6 (0.7) (3.7) (4.2)
Encompass brand expense ratio 30.1 30.5 29.6 — — — — — — — — —
Encompass brand combined ratio 106.1 95.9 106.5 13.2 5.2 12.6 (0.7) (3.7) (4.2) — — —
Allstate Protection loss ratio 66.8 64.4 68.9 6.9 4.5 8.8 (0.7) (1.0) (2.7)
Allstate Protection expense ratio 26.7 27.1 26.4 — — — — — — 0.2 0.3 0.5
Allstate Protection combined ratio 93.5 91.5 95.3 6.9 4.5 8.8 (0.7) (1.0) (2.7) 0.2 0.3 0.5
(1) Ratios are calculated using the premiums earned for the respective line of business.
Auto loss ratio for the Allstate brand increased 0.7 points in 2014 compared to 2013, primarily due to increased
catastrophe losses. Auto loss ratio for the Allstate brand decreased 1.8 points in 2013 compared to 2012, primarily due
to lower catastrophe losses, partially offset by lower favorable reserve reestimates.
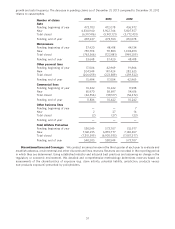
Claim frequency in the bodily injury coverages in 2014 was comparable to 2013. Claim frequency in the property
damage coverages increased 0.5% in 2014 compared to 2013. We experienced increased property damage frequency in
first quarter 2014 due to severe winter weather experienced in the Midwest and East and in the first two months of
fourth quarter 2014 in geographically widespread areas with improved unemployment rates leading to higher miles
driven and areas that experienced higher precipitation. Otherwise, frequencies in bodily injury and property damage
performed within historical ranges. Bodily injury and property damage coverage paid claim severities increased 2.7%
and 4.1%, respectively, in 2014 compared to 2013. Severity results in 2014 increased in line with historical Consumer
Price Index trends. Claim frequencies in the bodily injury and property damage coverages decreased 1.1% and increased
0.3%, respectively, in 2013 compared to 2012. Bodily injury and property damage coverage paid claim severities
increased 3.8% and 1.8%, respectively, in 2013 compared to 2012. We pursue rate increases when necessary to
maintain margins.
Esurance brand auto loss ratio decreased 1.7 points in 2014 compared to 2013, primarily due to rate actions and
favorable reserve reestimates related to personal injury protection losses. We manage the business so that it is
profitable over the life of the business, taking rate increases as appropriate. Esurance brand auto loss ratio increased
1.3 points in 2013 compared to 2012, primarily due to increases in the volume of new business, increased utilization of
price discounts and higher unallocated loss adjustment expense, partially offset by lower catastrophe losses.
Encompass brand auto loss ratio increased 3.6 points in 2014 compared to 2013, due to increased catastrophe
losses and lower favorable reserve reestimates, partially offset by increased premiums earned. Encompass brand auto
41