Allstate 2014 Annual Report Download - page 58
Download and view the complete annual report
Please find page 58 of the 2014 Allstate annual report below. You can navigate through the pages in the report by either clicking on the pages listed below, or by using the keyword search tool below to find specific information within the annual report.-
 1
1 -
2
-
3
-
4
-
5
-
6
-
7
-
8
-
9
-
10
-
11
-
12
-
13
-
14
-
15
-
16
-
17
-
18
-
19
-
20
-
21
-
22
-
23
-
24
-
25
-
26
-
27
-
28
-
29
-
30
-
31
-
32
-
33
-
34
-
35
-
36
-
37
-
38
-
39
-
40
-
41
-
42
-
43
-
44
-
45
-
46
-
47
-
 48
48 -
 49
49 -
 50
50 -
 51
51 -
 52
52 -
 53
53 -
 54
54 -
 55
55 -
 56
56 -
 57
57 -
 58
58 -
 59
59 -
 60
60 -
 61
61 -
 62
62 -
 63
63 -
 64
64 -
 65
65 -
 66
66 -
 67
67 -
 68
68 -
69
-
70
-
71
-
72
-
73
-
74
-
75
-
76
-
77
-
78
-
79
-
80
-
81
-
82
-
83
-
84
-
85
-
86
-
87
-
88
-
89
-
90
-
91
-
92
-
93
-
94
-
95
-
96
-
97
-
98
-
99
-
100
-
101
-
102
-
103
-
104
-
105
-
106
-
107
-
108
-
109
-
110
-
111
-
112
-
113
-
114
-
115
-
116
-
117
-
118
-
119
-
120
-
121
-
122
-
123
-
124
-
125
-
126
-
127
-
128
-
129
-
130
-
131
-
132
-
133
-
134
-
135
-
136
-
137
-
138
-
139
-
140
-
141
-
142
-
143
-
144
-
145
-
146
-
147
-
148
-
149
-
150
-
151
-
152
-
153
-
154
-
155
-
156
-
157
-
158
-
159
-
160
-
161
-
162
-
163
-
164
-
165
-
166
-
167
-
168
-
169
-
170
-
171
-
172
-
173
-
174
-
175
-
176
-
177
-
178
-
179
-
180
-
181
-
182
-
183
-
184
-
185
-
186
-
187
-
188
-
189
-
190
-
191
-
192
-
193
-
194
-
195
-
196
-
197
-
198
-
199
-
200
-
201
-
202
-
203
-
204
-
205
-
206
-
207
-
208
-
209
-
210
-
211
-
212
-
213
-
214
-
215
-
216
-
217
-
218
-
219
-
220
-
221
-
222
-
223
-
224
-
225
-
226
-
227
-
228
-
229
-
230
-
231
-
232
-
233
-
234
-
235
-
236
-
237
-
238
-
239
-
240
-
241
-
242
-
243
-
244
-
245
-
246
-
247
-
248
-
249
-
250
-
251
-
252
-
253
-
254
-
255
-
256
-
257
-
258
-
259
-
260
-
261
-
262
-
263
-
264
-
265
-
266
-
267
-
268
-
269
-
270
-
271
-
272
-
273
-
274
-
275
-
276
-
277
-
278
-
279
-
280
 |
 |

9MAR201204034531
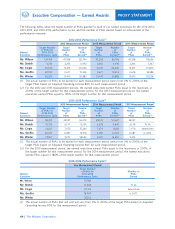
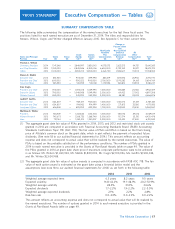
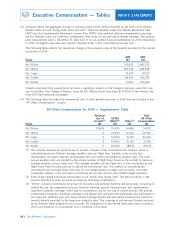
Executive Compensation — Tables
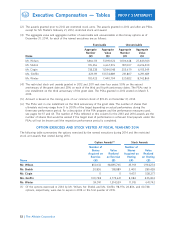
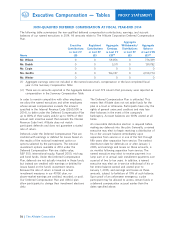
(3) Amounts reflect the aggregate increase in actuarial value of the pension benefits as set forth in the Pension
Benefits table, accrued during 2014, 2013, and 2012. These are benefits under the Allstate Retirement Plan
(ARP) and the Supplemental Retirement Income Plan (SRIP). Non-qualified deferred compensation earnings
are not reflected since our Deferred Compensation Plan does not provide above-market earnings. The pension
plan measurement date is December 31. (See note 17 to our audited financial statements for 2014.) Beginning
in 2014, all eligible employees earn pension benefits under a new cash balance formula only.
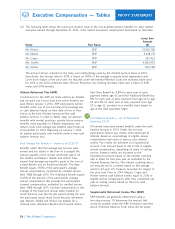
The following table reflects the respective change in the actuarial value of the benefits provided to the named
executives in 2014:
ARP SRIP
Name ($) ($)
Mr. Wilson 190,510 2,441,705
Mr. Shebik 218,748 608,948
Mr. Civgin 14,334 121,551
Ms. Greffin 218,955 946,219
Mr. Winter 10,011 129,065
Interest rates and other assumptions can have a significant impact on the change in pension value from one
year to another. The Change in Pension Value for Mr. Wilson would have been $1,701,000 if the interest rate
from 2013 had remained unchanged.
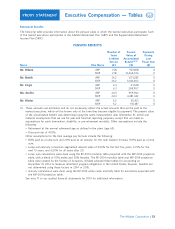
(4) The following table describes the incremental cost of other benefits provided in 2014 that are included in the
‘‘All Other Compensation’’ column.
All Other Compensation for 2014 — Supplemental Table
Personal Total
Use of 401(k) All Other
Aircraft(1) Match(2) Other(3) Compensation
Name ($) ($) ($) ($)
Mr. Wilson 59,865 10,400 24,486 94,751
Mr. Shebik 0 10,400 16,560 26,960
Mr. Civgin 0 10,400 16,160 26,560
Ms. Greffin 0 10,400 16,787 27,187
Mr. Winter 0 10,400 28,616 39,016
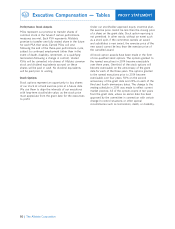
(1) The amount reported for personal use of aircraft is based on the incremental cost method, which is
calculated based on Allstate’s average variable costs per flight hour. Variable costs include fuel,
maintenance, on-board catering, landing/ramp fees, and other miscellaneous variable costs. The total
annual variable costs are divided by the annual number of flight hours flown by the aircraft to derive an
average variable cost per flight hour. This average variable cost per flight hour is then multiplied by the
flight hours flown for personal use to derive the incremental cost. This method of calculating the
incremental cost excludes fixed costs that do not change based on usage, such as pilots’ and other
employees’ salaries, costs incurred in purchasing the aircraft, and non-trip related hangar expenses.
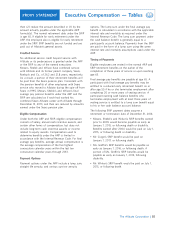
(2) Each of the named executives participated in our 401(k) plan during 2014. The amount shown is the
amount allocated to their accounts as employer matching contributions.
(3) ‘‘Other’’ consists of premiums for group life insurance and personal benefits and perquisites consisting of
mobile devices, tax preparation services, financial planning, ground transportation, and supplemental
long-term disability coverage. There was no incremental cost for the use of mobile devices. We provide
supplemental long-term disability coverage to all regular full- and part-time employees who participate in
the long-term disability plan and whose annual earnings exceed the level which produces the maximum
monthly benefit provided by the long-term disability plan. This coverage is self-insured (funded and paid
for by Allstate when obligations are incurred). No obligations for the named executives were incurred in
2014, and therefore, no incremental cost is reflected in the table.
48
PROXY STATEMENT
The Allstate Corporation