Allstate 2014 Annual Report Download - page 174
Download and view the complete annual report
Please find page 174 of the 2014 Allstate annual report below. You can navigate through the pages in the report by either clicking on the pages listed below, or by using the keyword search tool below to find specific information within the annual report.-
 1
1 -
2
-
3
-
4
-
5
-
6
-
7
-
8
-
9
-
10
-
11
-
12
-
13
-
14
-
15
-
16
-
17
-
18
-
19
-
20
-
21
-
22
-
23
-
24
-
25
-
26
-
27
-
28
-
29
-
30
-
31
-
32
-
33
-
34
-
35
-
36
-
37
-
38
-
39
-
40
-
41
-
42
-
43
-
44
-
45
-
46
-
47
-
48
-
49
-
50
-
51
-
52
-
53
-
54
-
55
-
56
-
57
-
58
-
59
-
60
-
61
-
62
-
63
-
64
-
65
-
66
-
67
-
68
-
69
-
70
-
71
-
72
-
73
-
74
-
75
-
76
-
77
-
78
-
79
-
80
-
81
-
82
-
83
-
84
-
85
-
86
-
87
-
88
-
89
-
90
-
91
-
92
-
93
-
94
-
95
-
96
-
97
-
98
-
99
-
100
-
101
-
102
-
103
-
104
-
105
-
106
-
107
-
108
-
109
-
110
-
111
-
112
-
113
-
114
-
115
-
116
-
117
-
118
-
119
-
120
-
121
-
122
-
123
-
124
-
125
-
126
-
127
-
128
-
129
-
130
-
131
-
132
-
133
-
134
-
135
-
136
-
137
-
138
-
139
-
140
-
141
-
142
-
143
-
144
-
145
-
146
-
147
-
148
-
149
-
150
-
151
-
152
-
153
-
154
-
155
-
156
-
157
-
158
-
159
-
160
-
161
-
162
-
163
-
 164
164 -
 165
165 -
 166
166 -
 167
167 -
 168
168 -
 169
169 -
 170
170 -
 171
171 -
 172
172 -
 173
173 -
 174
174 -
 175
175 -
 176
176 -
 177
177 -
 178
178 -
 179
179 -
 180
180 -
 181
181 -
 182
182 -
 183
183 -
 184
184 -
185
-
186
-
187
-
188
-
189
-
190
-
191
-
192
-
193
-
194
-
195
-
196
-
197
-
198
-
199
-
200
-
201
-
202
-
203
-
204
-
205
-
206
-
207
-
208
-
209
-
210
-
211
-
212
-
213
-
214
-
215
-
216
-
217
-
218
-
219
-
220
-
221
-
222
-
223
-
224
-
225
-
226
-
227
-
228
-
229
-
230
-
231
-
232
-
233
-
234
-
235
-
236
-
237
-
238
-
239
-
240
-
241
-
242
-
243
-
244
-
245
-
246
-
247
-
248
-
249
-
250
-
251
-
252
-
253
-
254
-
255
-
256
-
257
-
258
-
259
-
260
-
261
-
262
-
263
-
264
-
265
-
266
-
267
-
268
-
269
-
270
-
271
-
272
-
273
-
274
-
275
-
276
-
277
-
278
-
279
-
280
 |
 |

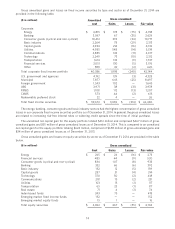
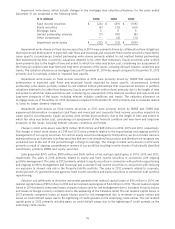
Gross unrealized gains and losses on fixed income securities by type and sector as of December 31, 2014 are
provided in the following table.
Gross unrealized
($ in millions) Amortized
cost Gains Losses Fair value
Corporate:
Energy $ 4,815 $ 178 $ (75) $ 4,918
Banking 3,597 67 (35) 3,629
Consumer goods (cyclical and non-cyclical) 10,412 393 (34) 10,771
Basic industry 2,264 78 (29) 2,313
Capital goods 3,934 214 (16) 4,132
Utilities 4,985 548 (14) 5,519
Communications 2,885 143 (11) 3,017
Technology 2,249 73 (10) 2,312
Transportation 1,614 132 (9) 1,737
Financial services 3,051 130 (5) 3,176
Other 580 42 (2) 620
Total corporate fixed income portfolio 40,386 1,998 (240) 42,144
U.S. government and agencies 4,192 139 (3) 4,328
Municipal 7,877 645 (25) 8,497
Foreign government 1,543 102 — 1,645
ABS 3,971 38 (31) 3,978
RMBS 1,108 112 (13) 1,207
CMBS 573 44 (2) 615
Redeemable preferred stock 22 4 — 26
Total fixed income securities $ 59,672 $ 3,082 $ (314) $ 62,440
The energy, banking, consumer goods and basic industry sectors had the highest concentration of gross unrealized
losses in our corporate fixed income securities portfolio as of December 31, 2014. In general, the gross unrealized losses
are related to increasing risk-free interest rates or widening credit spreads since the time of initial purchase.
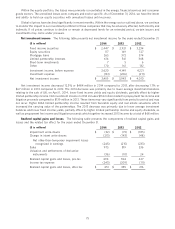
The unrealized net capital gain for the equity portfolio totaled $412 million and comprised $467 million of gross
unrealized gains and $55 million of gross unrealized losses as of December 31, 2014. This is compared to an unrealized
net capital gain for the equity portfolio totaling $624 million, comprised of $658 million of gross unrealized gains and
$34 million of gross unrealized losses as of December 31, 2013.
Gross unrealized gains and losses on equity securities by sector as of December 31, 2014 are provided in the table
below.
($ in millions) Gross unrealized
Cost Gains Losses Fair value
Energy $ 265 $ 24 $ (16) $ 273
Financial services 485 44 (9) 520
Consumer goods (cyclical and non-cyclical) 834 107 (8) 933
Banking 332 66 (6) 392
Basic industry 152 12 (5) 159
Capital goods 287 31 (4) 314
Technology 370 50 (2) 418
Communications 218 15 (2) 231
Utilities 103 15 (1) 117
Transportation 65 23 (1) 87
Real estate 71 4 (1) 74
Index-based funds 343 75 — 418
Emerging market fixed income funds 152 — — 152
Emerging market equity funds 15 1 — 16
Total equity securities $ 3,692 $ 467 $ (55) $ 4,104
74