Allstate 2014 Annual Report Download - page 192
Download and view the complete annual report
Please find page 192 of the 2014 Allstate annual report below. You can navigate through the pages in the report by either clicking on the pages listed below, or by using the keyword search tool below to find specific information within the annual report.-
 1
1 -
2
-
3
-
4
-
5
-
6
-
7
-
8
-
9
-
10
-
11
-
12
-
13
-
14
-
15
-
16
-
17
-
18
-
19
-
20
-
21
-
22
-
23
-
24
-
25
-
26
-
27
-
28
-
29
-
30
-
31
-
32
-
33
-
34
-
35
-
36
-
37
-
38
-
39
-
40
-
41
-
42
-
43
-
44
-
45
-
46
-
47
-
48
-
49
-
50
-
51
-
52
-
53
-
54
-
55
-
56
-
57
-
58
-
59
-
60
-
61
-
62
-
63
-
64
-
65
-
66
-
67
-
68
-
69
-
70
-
71
-
72
-
73
-
74
-
75
-
76
-
77
-
78
-
79
-
80
-
81
-
82
-
83
-
84
-
85
-
86
-
87
-
88
-
89
-
90
-
91
-
92
-
93
-
94
-
95
-
96
-
97
-
98
-
99
-
100
-
101
-
102
-
103
-
104
-
105
-
106
-
107
-
108
-
109
-
110
-
111
-
112
-
113
-
114
-
115
-
116
-
117
-
118
-
119
-
120
-
121
-
122
-
123
-
124
-
125
-
126
-
127
-
128
-
129
-
130
-
131
-
132
-
133
-
134
-
135
-
136
-
137
-
138
-
139
-
140
-
141
-
142
-
143
-
144
-
145
-
146
-
147
-
148
-
149
-
150
-
151
-
152
-
153
-
154
-
155
-
156
-
157
-
158
-
159
-
160
-
161
-
162
-
163
-
164
-
165
-
166
-
167
-
168
-
169
-
170
-
171
-
172
-
173
-
174
-
175
-
176
-
177
-
178
-
179
-
180
-
181
-
 182
182 -
 183
183 -
 184
184 -
 185
185 -
 186
186 -
 187
187 -
 188
188 -
 189
189 -
 190
190 -
 191
191 -
 192
192 -
 193
193 -
 194
194 -
 195
195 -
 196
196 -
 197
197 -
 198
198 -
 199
199 -
 200
200 -
 201
201 -
 202
202 -
203
-
204
-
205
-
206
-
207
-
208
-
209
-
210
-
211
-
212
-
213
-
214
-
215
-
216
-
217
-
218
-
219
-
220
-
221
-
222
-
223
-
224
-
225
-
226
-
227
-
228
-
229
-
230
-
231
-
232
-
233
-
234
-
235
-
236
-
237
-
238
-
239
-
240
-
241
-
242
-
243
-
244
-
245
-
246
-
247
-
248
-
249
-
250
-
251
-
252
-
253
-
254
-
255
-
256
-
257
-
258
-
259
-
260
-
261
-
262
-
263
-
264
-
265
-
266
-
267
-
268
-
269
-
270
-
271
-
272
-
273
-
274
-
275
-
276
-
277
-
278
-
279
-
280
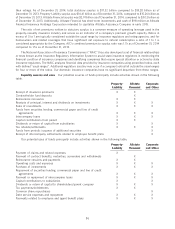
 |
 |

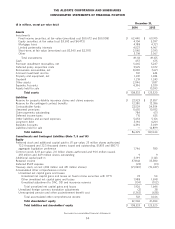
THE ALLSTATE CORPORATION AND SUBSIDIARIES
CONSOLIDATED STATEMENTS OF OPERATIONS
Year Ended December 31,
($ in millions, except per share data)
2014 2013 2012
Revenues
Property-liability insurance premiums (net of reinsurance ceded of
$1,030, $1,069 and $1,090) $ 28,929 $ 27,618 $ 26,737
Life and annuity premiums and contract charges (net of reinsurance
ceded of $416, $639 and $674) 2,157 2,352 2,241
Net investment income 3,459 3,943 4,010
Realized capital gains and losses:
Total other-than-temporary impairment (‘‘OTTI’’) losses (242) (207) (239)
OTTI losses reclassified to (from) other comprehensive income (3) (8) 6
Net OTTI losses recognized in earnings (245) (215) (233)
Sales and other realized capital gains and losses 939 809 560
Total realized capital gains and losses 694 594 327
35,239 34,507 33,315
Costs and expenses
Property-liability insurance claims and claims expense (net of
reinsurance ceded of $1,393, $1,717 and $2,051) 19,428 17,911 18,484
Life and annuity contract benefits (net of reinsurance ceded of $356,
$355 and $665) 1,765 1,917 1,818
Interest credited to contractholder funds (net of reinsurance ceded of
$26, $27 and $28) 919 1,278 1,316
Amortization of deferred policy acquisition costs 4,135 4,002 3,884
Operating costs and expenses 4,341 4,387 4,118
Restructuring and related charges 18 70 34
Loss on extinguishment of debt 1 491 —
Interest expense 322 367 373
30,929 30,423 30,027
(Loss) gain on disposition of operations (74) (688) 18
Income from operations before income tax expense 4,236 3,396 3,306
Income tax expense 1,386 1,116 1,000
Net income 2,850 2,280 2,306
Preferred stock dividends 104 17 —
Net income available to common shareholders $ 2,746 $ 2,263 $ 2,306
Earnings per common share:
Net income available to common shareholders per common share –
Basic $ 6.37 $ 4.87 $ 4.71
Weighted average common shares – Basic 431.4 464.4 489.4
Net income available to common shareholders per common share –
Diluted $ 6.27 $ 4.81 $ 4.68
Weighted average common shares – Diluted 438.2 470.3 493.0
Cash dividends declared per common share $ 1.12 $ 1.00 $ 0.88
See notes to consolidated financial statements.
92