Allstate 2014 Annual Report Download - page 226
Download and view the complete annual report
Please find page 226 of the 2014 Allstate annual report below. You can navigate through the pages in the report by either clicking on the pages listed below, or by using the keyword search tool below to find specific information within the annual report.-
 1
1 -
2
-
3
-
4
-
5
-
6
-
7
-
8
-
9
-
10
-
11
-
12
-
13
-
14
-
15
-
16
-
17
-
18
-
19
-
20
-
21
-
22
-
23
-
24
-
25
-
26
-
27
-
28
-
29
-
30
-
31
-
32
-
33
-
34
-
35
-
36
-
37
-
38
-
39
-
40
-
41
-
42
-
43
-
44
-
45
-
46
-
47
-
48
-
49
-
50
-
51
-
52
-
53
-
54
-
55
-
56
-
57
-
58
-
59
-
60
-
61
-
62
-
63
-
64
-
65
-
66
-
67
-
68
-
69
-
70
-
71
-
72
-
73
-
74
-
75
-
76
-
77
-
78
-
79
-
80
-
81
-
82
-
83
-
84
-
85
-
86
-
87
-
88
-
89
-
90
-
91
-
92
-
93
-
94
-
95
-
96
-
97
-
98
-
99
-
100
-
101
-
102
-
103
-
104
-
105
-
106
-
107
-
108
-
109
-
110
-
111
-
112
-
113
-
114
-
115
-
116
-
117
-
118
-
119
-
120
-
121
-
122
-
123
-
124
-
125
-
126
-
127
-
128
-
129
-
130
-
131
-
132
-
133
-
134
-
135
-
136
-
137
-
138
-
139
-
140
-
141
-
142
-
143
-
144
-
145
-
146
-
147
-
148
-
149
-
150
-
151
-
152
-
153
-
154
-
155
-
156
-
157
-
158
-
159
-
160
-
161
-
162
-
163
-
164
-
165
-
166
-
167
-
168
-
169
-
170
-
171
-
172
-
173
-
174
-
175
-
176
-
177
-
178
-
179
-
180
-
181
-
182
-
183
-
184
-
185
-
186
-
187
-
188
-
189
-
190
-
191
-
192
-
193
-
194
-
195
-
196
-
197
-
198
-
199
-
200
-
201
-
202
-
203
-
204
-
205
-
206
-
207
-
208
-
209
-
210
-
211
-
212
-
213
-
214
-
215
-
 216
216 -
 217
217 -
 218
218 -
 219
219 -
 220
220 -
 221
221 -
 222
222 -
 223
223 -
 224
224 -
 225
225 -
 226
226 -
 227
227 -
 228
228 -
 229
229 -
 230
230 -
 231
231 -
 232
232 -
 233
233 -
 234
234 -
 235
235 -
 236
236 -
237
-
238
-
239
-
240
-
241
-
242
-
243
-
244
-
245
-
246
-
247
-
248
-
249
-
250
-
251
-
252
-
253
-
254
-
255
-
256
-
257
-
258
-
259
-
260
-
261
-
262
-
263
-
264
-
265
-
266
-
267
-
268
-
269
-
270
-
271
-
272
-
273
-
274
-
275
-
276
-
277
-
278
-
279
-
280
 |
 |

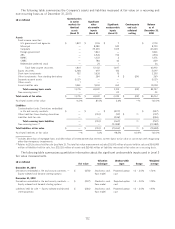
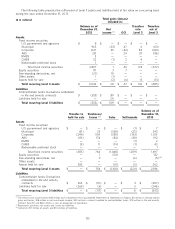
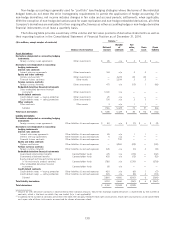
The following table presents the rollforward of Level 3 assets and liabilities held at fair value on a recurring basis
during the year ended December 31, 2012.
Total gains (losses)
($ in millions) included in:
Balance as of Transfers Transfers
December 31, Net into out of
2011 income (1) OCI Level 3 Level 3
Assets
Fixed income securities:
U.S. government and agencies $ — $ — $ — $ 8 $ —
Municipal 1,332 (35) 76 53 (28)
Corporate 1,405 20 68 387 (92)
ABS 297 26 61 43 (81)
RMBS 51 — — — (47)
CMBS 60 (4) 9 — (5)
Redeemable preferred stock 1 — — — —
Total fixed income securities 3,146 7 214 491 (253)
Equity securities 43 (7) 9 — —
Free-standing derivatives, net (95) 27 — — —
Other assets 1 — — — —
Total recurring Level 3 assets $ 3,095 $ 27 $ 223 $ 491 $ (253)
Liabilities
Contractholder funds: Derivatives embedded
in life and annuity contracts $ (723) $ 168 $ — $ — $ —
Total recurring Level 3 liabilities $ (723) $ 168 $ — $ — $ —
Balance as of
December 31,
Purchases Sales Issues Settlements 2012
Assets
Fixed income securities:
U.S. government and agencies $ — $ — $ — $ — $ 8
Municipal 46 (463) — (16) 965
Corporate 276 (310) — (137) 1,617
ABS 155 (217) — (33) 251
RMBS — — — (1) 3
CMBS 34 (27) — (15) 52
Redeemable preferred stock 1 (1) — — 1
Total fixed income securities 512 (1,018) — (202) 2,897
Equity securities 164 (38) — — 171
Free-standing derivatives, net 27 — — 14 (27) (2)
Other assets — — — — 1
Total recurring Level 3 assets $ 703 $ (1,056) $ — $ (188) $ 3,042
Liabilities
Contractholder funds: Derivatives
embedded in life and annuity contracts $ — $ — $ (79) $ 81 $ (553)
Total recurring Level 3 liabilities $ — $ — $ (79) $ 81 $ (553)
(1) The effect to net income totals $195 million and is reported in the Consolidated Statements of Operations as follows: $27 million in net investment
income, $132 million in interest credited to contractholder funds and $36 million in life and annuity contract benefits.
(2) Comprises $3 million of assets and $30 million of liabilities.
126