AT&T Wireless 2015 Annual Report Download - page 81
Download and view the complete annual report
Please find page 81 of the 2015 AT&T Wireless annual report below. You can navigate through the pages in the report by either clicking on the pages listed below, or by using the keyword search tool below to find specific information within the annual report.-
 1
1 -
2
-
3
-
4
-
5
-
6
-
7
-
8
-
9
-
10
-
11
-
12
-
13
-
14
-
15
-
16
-
17
-
18
-
19
-
20
-
21
-
22
-
23
-
24
-
25
-
26
-
27
-
28
-
29
-
30
-
31
-
32
-
33
-
34
-
35
-
36
-
37
-
38
-
39
-
40
-
41
-
42
-
43
-
44
-
45
-
46
-
47
-
48
-
49
-
50
-
51
-
52
-
53
-
54
-
55
-
56
-
57
-
58
-
59
-
60
-
61
-
62
-
63
-
64
-
65
-
66
-
67
-
68
-
69
-
70
-
 71
71 -
 72
72 -
 73
73 -
 74
74 -
 75
75 -
 76
76 -
 77
77 -
 78
78 -
 79
79 -
 80
80 -
 81
81 -
 82
82 -
 83
83 -
 84
84 -
 85
85 -
 86
86 -
 87
87 -
 88
88
 |
 |

AT&T INC.
|
79
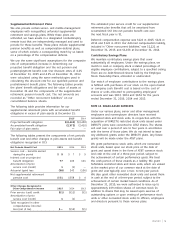
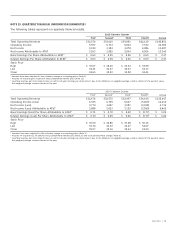
NOTE 19. QUARTERLY FINANCIAL INFORMATION (UNAUDITED)
The following tables represent our quarterly financial results:
2015 Calendar Quarter
First1 Second1 Third Fourth2 Annual
Total Operating Revenues $32,576 $33,015 $39,091 $42,119 $146,801
Operating Income 5,557 5,773 5,923 7,532 24,785
Net Income 3,339 3,184 3,078 4,086 13,687
Net Income Attributable to AT&T 3,263 3,082 2,994 4,006 13,345
Basic Earnings Per Share Attributable to AT&T3 $ 0.63 $ 0.59 $ 0.50 $ 0.65 $ 2.37
Diluted Earnings Per Share Attributable to AT&T3 $ 0.63 $ 0.59 $ 0.50 $ 0.65 $ 2.37
Stock Price
High $ 35.07 $ 36.45 $ 35.93 $ 34.99
Low 32.41 32.37 30.97 32.17
Close 32.65 35.52 32.58 34.41
1 Amounts have been adjusted for the voluntary change in accounting policy (Note 1).
2 Includes an actuarial gain on pension and postretirement benefit plans (Note 12).
3 Quarterly earnings per share impacts may not add to full-year earnings per share impacts due to the difference in weighted-average common shares for the quarters versus
the weighted-average common shares for the year.
2014 Calendar Quarter
First1 Second1 Third1 Fourth1,2 Annual
Total Operating Revenues $32,476 $32,575 $32,957 $34,439 $132,447
Operating Income (Loss) 6,335 5,739 5,607 (5,469) 12,212
Net Income (Loss) 3,770 3,697 3,187 (3,918) 6,736
Net Income (Loss) Attributable to AT&T 3,688 3,623 3,130 (3,999) 6,442
Basic Earnings (Loss) Per Share Attributable to AT&T3 $ 0.71 $ 0.70 $ 0.60 $ (0.77) $ 1.24
Diluted Earnings (Loss) Per Share Attributable to AT&T3 $ 0.70 $ 0.69 $ 0.60 $ (0.77) $ 1.24
Stock Price
High $ 35.50 $ 36.86 $ 37.48 $ 36.16
Low 31.74 34.32 34.17 32.07
Close 35.07 35.36 35.24 33.59
1 Amounts have been adjusted for the voluntary change in accounting policy (Note 1).
2 Includes an actuarial loss on pension and postretirement benefit plans (Note 12) and asset abandonment charges (Note 6).
3 Quarterly earnings per share impacts may not add to full-year earnings per share impacts due to the difference in weighted-average common shares for the quarters versus
the weighted-average common shares for the year.