AT&T Wireless 2015 Annual Report Download - page 75
Download and view the complete annual report
Please find page 75 of the 2015 AT&T Wireless annual report below. You can navigate through the pages in the report by either clicking on the pages listed below, or by using the keyword search tool below to find specific information within the annual report.-
 1
1 -
2
-
3
-
4
-
5
-
6
-
7
-
8
-
9
-
10
-
11
-
12
-
13
-
14
-
15
-
16
-
17
-
18
-
19
-
20
-
21
-
22
-
23
-
24
-
25
-
26
-
27
-
28
-
29
-
30
-
31
-
32
-
33
-
34
-
35
-
36
-
37
-
38
-
39
-
40
-
41
-
42
-
43
-
44
-
45
-
46
-
47
-
48
-
49
-
50
-
51
-
52
-
53
-
54
-
55
-
56
-
57
-
58
-
59
-
60
-
61
-
62
-
63
-
64
-
 65
65 -
 66
66 -
 67
67 -
 68
68 -
 69
69 -
 70
70 -
 71
71 -
 72
72 -
 73
73 -
 74
74 -
 75
75 -
 76
76 -
 77
77 -
 78
78 -
 79
79 -
 80
80 -
 81
81 -
 82
82 -
 83
83 -
 84
84 -
 85
85 -
86
-
87
-
88
 |
 |

AT&T INC.
|
73
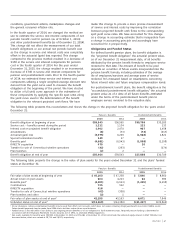
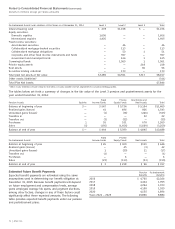
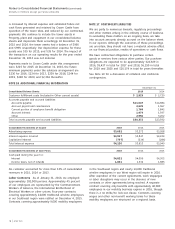
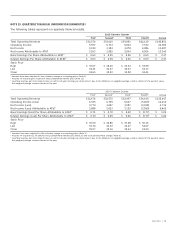
The tables below set forth a summary of changes in the fair value of the Level 3 pension and postretirement assets for the
year ended December 31, 2015:
Fixed Private Real Estate
Income Equity and
Pension Assets Equities Funds Funds Real Assets Total
Balance at beginning of year $ — $ 444 $ 5,399 $ 4,845 $10,688
Realized gains (losses) (1) 29 426 416 870
Unrealized gains (losses) 1 (16) 132 (114) 3
Transfers in — — — 19 19
Transfers out — — (19) — (19)
Purchases — 29 436 474 939
Sales — (110) (1,448) (1,283) (2,841)
Balance at end of year $ — $376 $4,926 $4,357 $ 9,659
Fixed Private
Income Equity
Postretirement Assets Funds Funds Real Assets Total
Balance at beginning of year $ 3 $ 218 $ 96 $317
Realized gains (losses) — (16) (2) (18)
Unrealized gains (losses) — 24 (1) 23
Transfers in 15 — 25 40
Transfers out (1) — (25) (26)
Purchases — 30 1 31
Sales (1) (101) (13) (115)
Balance at end of year $16 $155 $81 $252
The following tables set forth by level, within the fair value hierarchy, the pension and postretirement assets and liabilities at
fair value as of December 31, 2014:
Pension Assets and Liabilities at Fair Value as of December 31, 2014 Level 1 Level 2 Level 3 Total
Non-interest bearing cash $ 45 $ — $ — $ 45
Interest bearing cash — 127 — 127
Foreign currency contracts — 25 — 25
Equity securities:
Domestic equities 8,613 74 — 8,687
International equities 4,805 171 — 4,976
Fixed income securities:
Asset-backed securities — 610 1 611
Mortgage-backed securities — 1,741 — 1,741
Collateralized mortgage-backed securities — 418 — 418
Collateralized mortgage obligations/REMICS — 531 — 531
Corporate and other fixed income instruments and funds 97 7,210 441 7,748
Government and municipal bonds 145 4,876 — 5,021
Private equity funds — — 5,399 5,399
Real estate and real assets — — 4,845 4,845
Commingled funds — 5,823 2 5,825
Securities lending collateral 310 3,140 — 3,450
Receivable for variation margin 6 — — 6
Purchased options 1 — — 1
Assets at fair value 14,022 24,746 10,688 49,456
Investments sold short and other liabilities at fair value (650) (260) — (910)
Total plan net assets at fair value $13,372 $24,486 $10,688 $48,546
Other assets (liabilities)1 (3,383)
Total Plan Net Assets $45,163
1 Other assets (liabilities) include amounts receivable, accounts payable and net adjustment for securities lending payable.