AT&T Wireless 2015 Annual Report Download - page 72
Download and view the complete annual report
Please find page 72 of the 2015 AT&T Wireless annual report below. You can navigate through the pages in the report by either clicking on the pages listed below, or by using the keyword search tool below to find specific information within the annual report.-
 1
1 -
2
-
3
-
4
-
5
-
6
-
7
-
8
-
9
-
10
-
11
-
12
-
13
-
14
-
15
-
16
-
17
-
18
-
19
-
20
-
21
-
22
-
23
-
24
-
25
-
26
-
27
-
28
-
29
-
30
-
31
-
32
-
33
-
34
-
35
-
36
-
37
-
38
-
39
-
40
-
41
-
42
-
43
-
44
-
45
-
46
-
47
-
48
-
49
-
50
-
51
-
52
-
53
-
54
-
55
-
56
-
57
-
58
-
59
-
60
-
61
-
 62
62 -
 63
63 -
 64
64 -
 65
65 -
 66
66 -
 67
67 -
 68
68 -
 69
69 -
 70
70 -
 71
71 -
 72
72 -
 73
73 -
 74
74 -
 75
75 -
 76
76 -
 77
77 -
 78
78 -
 79
79 -
 80
80 -
 81
81 -
 82
82 -
83
-
84
-
85
-
86
-
87
-
88
 |
 |

Notes to Consolidated Financial Statements (continued)
Dollars in millions except per share amounts
70
|
AT&T INC.
our obligation by $23. In 2015 our assumed annual
healthcare prescription drug cost trend rate for non-Medicare
eligible participants was 6.00%, trending to our ultimate
trend rate of 4.50% in 2021. Medicare-eligible retirees who
receive access to retiree health insurance coverage through
a private insurance marketplace are not subject to assumed
healthcare trend. In addition to the healthcare cost trend in
2015, we assumed an annual 2.50% growth in administrative
expenses and an annual 3.00% growth in dental claims.
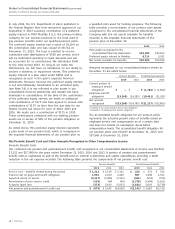
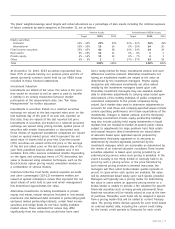
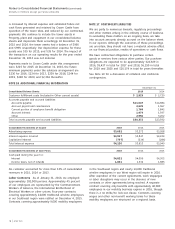
A one percentage-point change in the assumed combined
medical and dental cost trend rate would have the
following effects:
One Percentage- One Percentage-
Point Increase Point Decrease
Increase (decrease) in total of
service and interest cost components $ 58 $ (51)
Increase (decrease) in accumulated
postretirement benefit obligation 660 (590)
Plan Assets
Plan assets consist primarily of private and public equity,
government and corporate bonds, and real assets (real estate
and natural resources). The asset allocations of the pension
plans are maintained to meet ERISA requirements. Any plan
contributions, as determined by ERISA regulations, are made
to a pension trust for the benefit of plan participants. As part
of our voluntary contribution of the Mobility preferred equity
interest, we will contribute $735 of cash distributions during
2016. We do not have additional significant required
contributions to our pension plans for 2016.
We maintain VEBA trusts to partially fund postretirement
benefits; however, there are no ERISA or regulatory
requirements that these postretirement benefit plans be
funded annually.
The principal investment objectives are to ensure the availability
of funds to pay pension and postretirement benefits as they
become due under a broad range of future economic scenarios,
to maximize long-term investment return with an acceptable
level of risk based on our pension and postretirement
obligations, and to be broadly diversified across and within
the capital markets to insulate asset values against adverse
experience in any one market. Each asset class has broadly
diversified characteristics. Substantial biases toward any
particular investing style or type of security are sought to
be avoided by managing the aggregation of all accounts with
portfolio benchmarks. Asset and benefit obligation forecasting
studies are conducted periodically, generally every two to
three years, or when significant changes have occurred in
market conditions, benefits, participant demographics or
funded status. Decisions regarding investment policy are
made with an understanding of the effect of asset allocation
on funded status, future contributions and projected expenses.
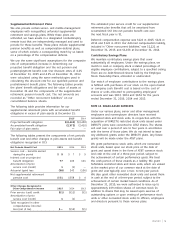
The current asset allocation policy and risk level for the
pension plan and VEBA assets is based on studies completed
and approved during 2013 and 2015, respectively, and is
reflected in the table below.
magnitude of cash outflows associated with our benefit
obligations. Neither the annual measurement of our total
benefit obligations nor annual net benefit cost is affected by
the full yield curve approach. For our pension benefits, the
single effective interest rate used for periodic service and
interest costs during 2015 are 4.60% and 3.30%, respectively.
For our postretirement benefits, the single effective interest
rate used for periodic service and interest costs during 2015
are 4.60% and 3.30%.
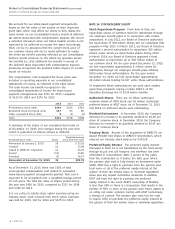
Expected Long-Term Rate of Return Our expected long-
term rate of return on pension plan assets is 7.75% for
2016 and 2015. Our expected long-term rate of return
on postretirement plan assets is 5.75% for 2016 and 2015.
Our long-term rates of return reflect the average rate of
earnings expected on the funds invested, or to be invested,
to provide for the benefits included in the projected benefit
obligations. In setting the long-term assumed rate of return,
management considers capital markets future expectations
and the asset mix of the plans’ investments. Actual long-
term return can, in relatively stable markets, also serve as
a factor in determining future expectations. We consider
many factors that include, but are not limited to, historical
returns on plan assets, current market information on
long-term returns (e.g., long-term bond rates) and current
and target asset allocations between asset categories. The
target asset allocation is determined based on consultations
with external investment advisers. If all other factors were
to remain unchanged, we expect that a 0.50% decrease in
the expected long-term rate of return would cause 2016
combined pension and postretirement cost to increase $232.
However, any differences in the rate and actual returns will
be included with the actuarial gain or loss recorded in the
fourth quarter when our plans are remeasured.
Composite Rate of Compensation Increase Our expected
composite rate of compensation increase cost of 3.10% in
2015 and 3.00% in 2014 reflects the long-term average rate
of salary increases.
Mortality Tables At December 31, 2015 we updated our
assumed mortality rates to reflect our best estimate of
future mortality, which decreased our pension obligation by
$859 and decreased our postretirement obligations by $274.
At December 31, 2014 we updated our assumed mortality
rates, which increased our pension obligation by $1,442 and
increased our postretirement obligations by $53.
Healthcare Cost Trend Our healthcare cost trend
assumptions are developed based on historical cost data,
the near-term outlook and an assessment of likely long-term
trends. Due to historical experience, updated expectations
of healthcare industry inflation and recent prescription
drug cost experience, our 2016 assumed annual healthcare
prescription drug cost trend for non-Medicare eligible
participants will increase to 6.25%, trending to our ultimate
trend rate of 4.50% in 2023 and for Medicare-eligible
participants will remain at an assumed annual and ultimate
trend rate of 4.50%. This change in assumption increased