AT&T Wireless 2015 Annual Report Download - page 46
Download and view the complete annual report
Please find page 46 of the 2015 AT&T Wireless annual report below. You can navigate through the pages in the report by either clicking on the pages listed below, or by using the keyword search tool below to find specific information within the annual report.-
 1
1 -
2
-
3
-
4
-
5
-
6
-
7
-
8
-
9
-
10
-
11
-
12
-
13
-
14
-
15
-
16
-
17
-
18
-
19
-
20
-
21
-
22
-
23
-
24
-
25
-
26
-
27
-
28
-
29
-
30
-
31
-
32
-
33
-
34
-
35
-
 36
36 -
 37
37 -
 38
38 -
 39
39 -
 40
40 -
 41
41 -
 42
42 -
 43
43 -
 44
44 -
 45
45 -
 46
46 -
 47
47 -
 48
48 -
 49
49 -
 50
50 -
 51
51 -
 52
52 -
 53
53 -
 54
54 -
 55
55 -
 56
56 -
57
-
58
-
59
-
60
-
61
-
62
-
63
-
64
-
65
-
66
-
67
-
68
-
69
-
70
-
71
-
72
-
73
-
74
-
75
-
76
-
77
-
78
-
79
-
80
-
81
-
82
-
83
-
84
-
85
-
86
-
87
-
88
 |
 |

44
|
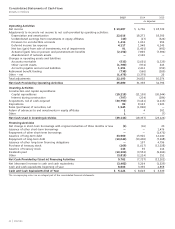
AT&T INC.
2015 2014 2013
As Adjusted
Operating Activities
Net income $ 13,687 $ 6,736 $ 18,722
Adjustments to reconcile net income to net cash provided by operating activities:
Depreciation and amortization 22,016 18,273 18,395
Undistributed earnings from investments in equity affiliates (49) (27) (324)
Provision for uncollectible accounts 1,416 1,032 954
Deferred income tax expense 4,117 1,948 6,345
Net loss (gain) from sale of investments, net of impairments 91 (1,461) (492)
Actuarial (gain) loss on pension and postretirement benefits (2,152) 7,869 (7,584)
Abandonment of network assets — 2,120 —
Changes in operating assets and liabilities:
Accounts receivable (535) (2,651) (1,329)
Other current assets (1,789) (974) 445
Accounts payable and accrued liabilities 1,291 2,412 (152)
Retirement benefit funding (735) (560) (209)
Other − net (1,478) (3,379) 25
Total adjustments 22,193 24,602 16,074
Net Cash Provided by Operating Activities 35,880 31,338 34,796
Investing Activities
Construction and capital expenditures:
Capital expenditures (19,218) (21,199) (20,944)
Interest during construction (797) (234) (284)
Acquisitions, net of cash acquired (30,759) (3,141) (4,113)
Dispositions 83 8,123 1,923
Sales (purchases) of securities, net 1,545 (1,890) —
Return of advances to and investments in equity affiliates 1 4 301
Other 1 — (7)
Net Cash Used in Investing Activities (49,144) (18,337) (23,124)
Financing Activities
Net change in short-term borrowings with original maturities of three months or less (1) (16) 20
Issuance of other short-term borrowings — — 1,476
Repayment of other short-term borrowings — — (1,476)
Issuance of long-term debt 33,969 15,926 12,040
Repayment of long-term debt (10,042) (10,400) (7,698)
Issuance of other long-term financing obligations — 107 4,796
Purchase of treasury stock (269) (1,617) (13,028)
Issuance of treasury stock 143 39 114
Dividends paid (10,200) (9,552) (9,696)
Other (3,818) (2,224) 251
Net Cash Provided by (Used in) Financing Activities 9,782 (7,737) (13,201)
Net (decrease) increase in cash and cash equivalents (3,482) 5,264 (1,529)
Cash and cash equivalents beginning of year 8,603 3,339 4,868
Cash and Cash Equivalents End of Year $ 5,121 $ 8,603 $ 3,339
The accompanying notes are an integral part of the consolidated financial statements.
Consolidated Statements of Cash Flows
Dollars in millions