AT&T Wireless 2015 Annual Report Download - page 22
Download and view the complete annual report
Please find page 22 of the 2015 AT&T Wireless annual report below. You can navigate through the pages in the report by either clicking on the pages listed below, or by using the keyword search tool below to find specific information within the annual report.-
 1
1 -
2
-
3
-
4
-
5
-
6
-
7
-
8
-
9
-
10
-
11
-
 12
12 -
 13
13 -
 14
14 -
 15
15 -
 16
16 -
 17
17 -
 18
18 -
 19
19 -
 20
20 -
 21
21 -
 22
22 -
 23
23 -
 24
24 -
 25
25 -
 26
26 -
 27
27 -
 28
28 -
 29
29 -
 30
30 -
 31
31 -
 32
32 -
33
-
34
-
35
-
36
-
37
-
38
-
39
-
40
-
41
-
42
-
43
-
44
-
45
-
46
-
47
-
48
-
49
-
50
-
51
-
52
-
53
-
54
-
55
-
56
-
57
-
58
-
59
-
60
-
61
-
62
-
63
-
64
-
65
-
66
-
67
-
68
-
69
-
70
-
71
-
72
-
73
-
74
-
75
-
76
-
77
-
78
-
79
-
80
-
81
-
82
-
83
-
84
-
85
-
86
-
87
-
88
 |
 |

Management’s Discussion and Analysis of Financial Condition and Results of Operations (continued)
Dollars in millions except per share amounts
20
|
AT&T INC.
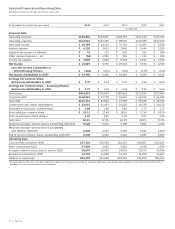
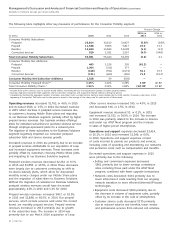
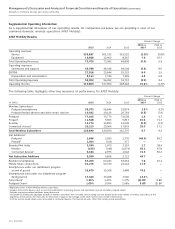
Supplemental Operating Information
As a supplemental discussion of our operating results, for comparison purposes, we are providing a view of our
combined domestic wireless operations (AT&T Mobility).
AT&T Mobility Results
Percent Change
2015 vs. 2014 vs.
2015 2014 2013 2014 2013
Operating revenues
Service $59,837 $61,032 $61,552 (2.0)% (0.8)%
Equipment 13,868 12,960 8,347 7.0 55.3
Total Operating Revenues 73,705 73,992 69,899 (0.4) 5.9
Operating expenses
Operations and support 45,789 48,348 44,508 (5.3) 8.6
EBITDA 27,916 25,644 25,391 8.9 1.0
Depreciation and amortization 8,113 7,744 7,249 4.8 6.8
Total Operating Expenses 53,902 56,092 51,757 (3.9) 8.4
Operating Income $19,803 $17,900 $18,142 10.6% (1.3)%
The following table highlights other key measures of performance for AT&T Mobility:
Percent Change
2015 vs. 2014 vs.
(in 000s) 2015 2014 2013 2014 2013
Wireless Subscribers1
Postpaid smartphones 58,073 56,644 51,874 2.5% 9.2%
Postpaid feature phones and data-centric devices 19,032 19,126 20,764 (0.5) (7.9)
Postpaid 77,105 75,770 72,638 1.8 4.3
Prepaid5 11,548 9,965 5,817 15.9 71.3
Reseller 13,774 13,855 14,028 (0.6) (1.2)
Connected devices2 26,213 20,964 17,893 25.0 17.2
Total Wireless Subscribers 128,640 120,554 110,376 6.7 9.2
Net Additions3
Postpaid 1,666 3,290 1,776 (49.4) 85.2
Prepaid5 1,364 (311) 377 — —
Branded Net Adds 3,030 2,979 2,153 1.7 38.4
Reseller (155) (346) (1,074) 55.2 67.8
Connected devices2 5,184 2,975 1,642 74.3 81.2
Net Subscriber Additions 8,059 5,608 2,721 43.7 —
Branded smartphones 67,200 62,443 54,262 7.6 15.1
Mobile Share connections 61,275 52,370 21,143 17.0 —
Smartphones under our installment program
at end of period 26,670 15,308 1,488 74.2 —
Smartphones sold under our installment program
during period 17,320 15,268 1,540 13.4% —
Total Churn4 1.39% 1.45% 1.37% (6) BP 8 BP
Postpaid Churn4 1.09% 1.04% 1.06% 5 BP (2) BP
1 Represents 100% of AT&T Mobility wireless subscribers.
2 Includes data-centric devices such as session-based tablets, monitoring devices and automobile systems. Excludes postpaid tablets.
3 Excludes acquisition-related additions during the period.
4
Calculated by dividing the aggregate number of wireless subscribers who canceled service during a period divided by the total number of wireless subscribers at the
beginning of that period. The churn rate for the period is equal to the average of the churn rate for each month of that period.
5 In 2015, session-based tablets were reclassified to connected devices. Prior period amounts reflect the current period presentation.