AT&T Wireless 2015 Annual Report Download - page 18
Download and view the complete annual report
Please find page 18 of the 2015 AT&T Wireless annual report below. You can navigate through the pages in the report by either clicking on the pages listed below, or by using the keyword search tool below to find specific information within the annual report.
Management’s Discussion and Analysis of Financial Condition and Results of Operations (continued)
Dollars in millions except per share amounts
16
|
AT&T INC.
Entertainment Group
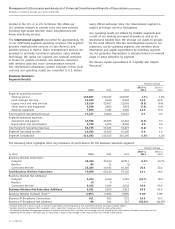
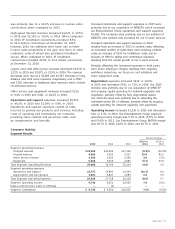
Segment Results
Percent Change
2015 vs. 2014 vs.
2015 2014 2013 2014 2013
Segment operating revenues
Video entertainment $20,271 $ 6,826 $ 5,810 — 17.5%
High-speed Internet 6,601 5,522 4,219 19.5 30.9
Legacy voice and data services 5,914 7,592 9,667 (22.1) (21.5)
Other service and equipment 2,508 2,293 1,846 9.4 24.2
Total Segment Operating Revenues 35,294 22,233 21,542 58.7 3.2
Segment operating expenses
Operations and support 28,345 18,992 17,943 49.2 5.8
Depreciation and amortization 4,945 4,473 4,815 10.6 (7.1)
Total Segment Operating Expenses 33,290 23,465 22,758 41.9 3.1
Segment Operating Income (Loss) 2,004 (1,232) (1,216) — (1.3)
Equity in Net Income (Loss) of Affiliates (4) (2) — — —
Segment Contribution $ 2,000 $ (1,234) $ (1,216) — (1.5)%
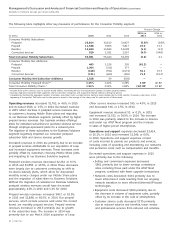
The following table highlights other key measures of performance for the Entertainment Group segment:
Percent Change
2015 vs. 2014 vs.
(in 000s) 2015 2014 2013 2014 2013
Video Connections
Satellite 19,784 — — — —
U-verse 5,614 5,920 5,257 (5.2) 12.6
Total Video Connections 25,398 5,920 5,257 — 12.6
Video Net Additions1
Satellite 240 — — — —
U-verse (306) 663 889 — (25.4)
Net Video Additions (66) 663 889 — (25.4)
Broadband Connections
IP 12,356 11,383 9,484 8.5 20.0
DSL 1,930 3,061 4,829 (36.9) (36.6)
Total Broadband Connections 14,286 14,444 14,313 (1.1) 0.9
Broadband Net Additions
IP 973 1,899 2,266 (48.8) (16.2)
DSL (1,130) (1,768) (2,103) 36.1 15.9
Net Broadband Additions (157) 131 163 — (19.6)
Retail Consumer Switched Access Lines 7,286 9,243 12,013 (21.2) (23.1)
U-verse Consumer VoIP Connections 5,212 4,759 3,701 9.5 28.6
Total Retail Consumer Voice Connections 12,498 14,002 15,714 (10.7)% (10.9)%
1 Excludes acquisition-related additions during the period.
Video entertainment revenues increased $13,445 in
2015 and $1,016, or 17.5%, in 2014. The 2015 increase
was primarily related to our acquisition of DIRECTV.
With our acquisition of DIRECTV, we are now focusing
our sales efforts on satellite service as there are lower
content costs for satellite subscribers. U-verse video
revenue increased $932 in 2015. The 2014 increase
Operating revenues increased $13,061, or 58.7%, in 2015
and $691, or 3.2%, in 2014. Our July 2015 acquisition of
DIRECTV was largely responsible for higher revenues
beginning in the third quarter of 2015. Also contributing to
the increases was continued strong growth in consumer
IP broadband and U-verse video, which more than offset
lower revenues from legacy voice and data products.


