AT&T Wireless 2015 Annual Report Download - page 49
Download and view the complete annual report
Please find page 49 of the 2015 AT&T Wireless annual report below. You can navigate through the pages in the report by either clicking on the pages listed below, or by using the keyword search tool below to find specific information within the annual report.-
 1
1 -
2
-
3
-
4
-
5
-
6
-
7
-
8
-
9
-
10
-
11
-
12
-
13
-
14
-
15
-
16
-
17
-
18
-
19
-
20
-
21
-
22
-
23
-
24
-
25
-
26
-
27
-
28
-
29
-
30
-
31
-
32
-
33
-
34
-
35
-
36
-
37
-
38
-
 39
39 -
 40
40 -
 41
41 -
 42
42 -
 43
43 -
 44
44 -
 45
45 -
 46
46 -
 47
47 -
 48
48 -
 49
49 -
 50
50 -
 51
51 -
 52
52 -
 53
53 -
 54
54 -
 55
55 -
 56
56 -
 57
57 -
 58
58 -
 59
59 -
60
-
61
-
62
-
63
-
64
-
65
-
66
-
67
-
68
-
69
-
70
-
71
-
72
-
73
-
74
-
75
-
76
-
77
-
78
-
79
-
80
-
81
-
82
-
83
-
84
-
85
-
86
-
87
-
88
 |
 |

AT&T INC.
|
47
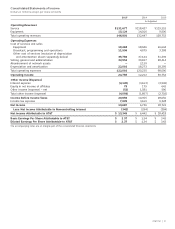
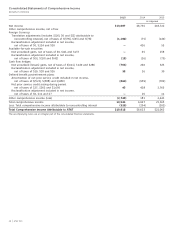
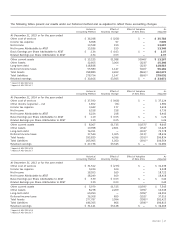
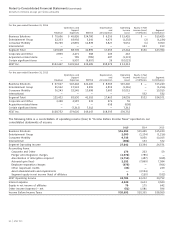
The following tables present our results under our historical method and as adjusted to reflect these accounting changes:
Historical Effect of Effect of Adoption As
Accounting Method Voluntary Change of New ASUs Adjusted
At December 31, 2015 or for the year ended
Other cost of services $ 36,038 $ (256) $ — $ 35,782
Income tax expense 6,908 97 — 7,005
Net Income 13,528 159 — 13,687
Net Income Attributable to AT&T 13,186 159 — 13,345
Basic Earnings per Share Attributable to AT&T $ 2.34 $ 0.03 $ — $ 2.37
Diluted Earnings per Share Attributable to AT&T 2.34 0.03 — 2.37
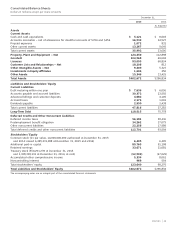
Other current assets $ 12,225 $1,588 $(546)2 $ 13,267
Other Assets 12,605 3,064 (323)1 15,346
Long-term debt 118,838 — (323)1 118,515
Deferred income taxes 55,580 1,147 (546)2 56,181
Total Assets 398,889 4,652 (869)1,2 402,672
Total Liabilities 278,754 1,147 (869)1,2 279,032
Retained earnings $ 30,166 $3,505 $ — $ 33,671
1 Impact of ASU 2015-03.
2 Impact of ASU 2015-17.
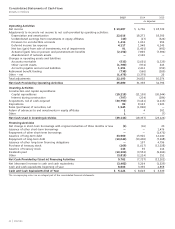
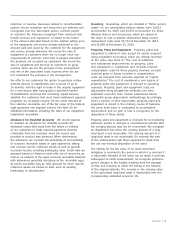
Historical Effect of Effect of Adoption As
Accounting Method Voluntary Change of New ASUs Adjusted
At December 31, 2014 or for the year ended
Other cost of services $ 37,590 $ (466) $ — $ 37,124
Other income (expense) – net 1,652 (71) — 1,581
Income tax expense 3,442 177 — 3,619
Net Income 6,518 218 — 6,736
Net Income Attributable to AT&T 6,224 218 — 6,442
Basic Earnings per Share Attributable to AT&T $ 1.19 $ 0.05 $ — $ 1.24
Diluted Earnings per Share Attributable to AT&T 1.19 0.05 — 1.24
Other current assets $ 8,067 $1,735 $(157)2 $ 9,645
Other Assets 10,998 2,661 (234)1 13,425
Long-term debt 76,011 — (233)1 75,778
Deferred income taxes 37,544 1,005 (113)2 38,436
Total Assets 292,829 4,396 (391)1,2 296,834
Total Liabilities 205,905 1,050 (391)1,2 206,564
Retained earnings $ 27,736 $3,345 $ — $ 31,081
1 Impact of ASU 2015-03.
2 Impact of ASU 2015-17.
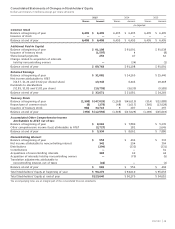
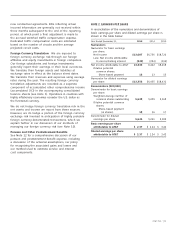
Historical Effect of Effect of Adoption As
Accounting Method Voluntary Change of New ASUs Adjusted
At December 31, 2013 or for the year ended
Other cost of services $ 31,512 $ (273) $ — $ 31,239
Income tax expense 9,224 104 — 9,328
Net Income 18,553 169 — 18,722
Net Income Attributable to AT&T 18,249 169 — 18,418
Basic Earnings per Share Attributable to AT&T $ 3.39 $ 0.03 $ — $ 3.42
Diluted Earnings per Share Attributable to AT&T 3.39 0.03 — 3.42
Other current assets $ 5,979 $1,725 $(159)2 $ 7,545
Other Assets 8,278 2,269 (199)1 10,348
Long-term debt 69,290 — (199)1 69,091
Deferred income taxes 36,308 859 (152)2 37,015
Total Assets 277,787 3,994 (358)1,2 281,423
Total Liabilities 186,305 866 (358)1,2 186,813
Retained earnings $ 31,141 $3,128 $ — $ 34,269
1 Impact of ASU 2015-03.
2 Impact of ASU 2015-17.