AT&T Wireless 2015 Annual Report Download - page 74
Download and view the complete annual report
Please find page 74 of the 2015 AT&T Wireless annual report below. You can navigate through the pages in the report by either clicking on the pages listed below, or by using the keyword search tool below to find specific information within the annual report.-
 1
1 -
2
-
3
-
4
-
5
-
6
-
7
-
8
-
9
-
10
-
11
-
12
-
13
-
14
-
15
-
16
-
17
-
18
-
19
-
20
-
21
-
22
-
23
-
24
-
25
-
26
-
27
-
28
-
29
-
30
-
31
-
32
-
33
-
34
-
35
-
36
-
37
-
38
-
39
-
40
-
41
-
42
-
43
-
44
-
45
-
46
-
47
-
48
-
49
-
50
-
51
-
52
-
53
-
54
-
55
-
56
-
57
-
58
-
59
-
60
-
61
-
62
-
63
-
 64
64 -
 65
65 -
 66
66 -
 67
67 -
 68
68 -
 69
69 -
 70
70 -
 71
71 -
 72
72 -
 73
73 -
 74
74 -
 75
75 -
 76
76 -
 77
77 -
 78
78 -
 79
79 -
 80
80 -
 81
81 -
 82
82 -
 83
83 -
 84
84 -
85
-
86
-
87
-
88
 |
 |

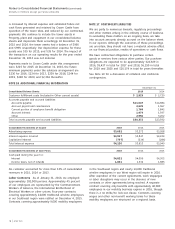
Notes to Consolidated Financial Statements (continued)
Dollars in millions except per share amounts
72
|
AT&T INC.
Non-interest bearing cash and overdrafts are valued at cost,
which approximates fair value.
Fair Value Measurements
See Note 10 for a discussion of fair value hierarchy that
prioritizes the inputs to valuation techniques used to
measure fair value.
rating, sector add-ons or credits, issue-specific add-ons or
credits as well as call or other options.
Purchases and sales of securities are recorded as of the
trade date. Realized gains and losses on sales of securities
are determined on the basis of average cost. Interest income
is recognized on the accrual basis. Dividend income is
recognized on the ex-dividend date.
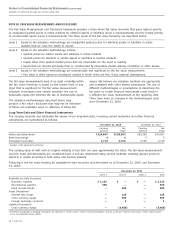
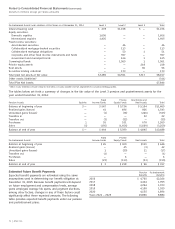
The following tables set forth by level, within the fair value hierarchy, the pension and postretirement assets and liabilities at
fair value as of December 31, 2015:
Pension Assets and Liabilities at Fair Value as of December 31, 2015 Level 1 Level 2 Level 3 Total
Non-interest bearing cash $ 160 $ — $ — $ 160
Interest bearing cash — 25 — 25
Foreign currency contracts — 25 — 25
Equity securities:
Domestic equities 8,315 4 — 8,319
International equities 4,287 — — 4,287
Fixed income securities:
Asset-backed securities — 403 1 404
Mortgage-backed securities — 792 — 792
Collateralized mortgage-backed securities — 278 — 278
Collateralized mortgage obligations/REMICS — 345 — 345
Corporate and other fixed income instruments and funds 65 8,274 373 8,712
Government and municipal bonds 75 4,495 - 4,570
Private equity funds — — 4,926 4,926
Real estate and real assets — — 4,357 4,357
Commingled funds — 5,522 2 5,524
Securities lending collateral 512 3,538 — 4,050
Receivable for variation margin 13 — — 13
Assets at fair value 13,427 23,701 9,659 46,787
Investments sold short and other liabilities at fair value (824) (12) — (836)
Total plan net assets at fair value $12,603 $23,689 $9,659 $ 45,951
Other assets (liabilities)1 (3,756)
Total Plan Net Assets $42,195
1
Other assets (liabilities) include amounts receivable, accounts payable and net adjustment for securities lending payable.
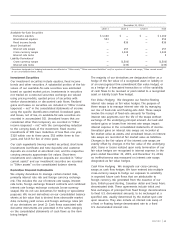
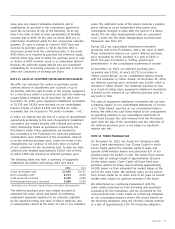
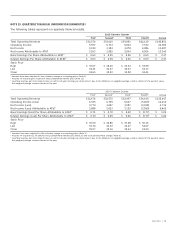
Postretirement Assets and Liabilities at Fair Value as of December 31, 2015 Level 1 Level 2 Level 3 Total
Non-interest bearing cash $ 2 $ — $ — $ 2
Interest bearing cash 220 1,292 — 1,512
Foreign currencies 4 — — 4
Equity securities:
Domestic equities 1,187 — — 1,187
International equities 869 — — 869
Fixed income securities:
Asset-backed securities — 35 2 37
Collateralized mortgage-backed securities — 120 13 133
Collateralized mortgage obligations — 45 — 45
Corporate and other fixed income instruments and funds — 389 — 389
Government and municipal bonds — 617 — 617
Commingled funds — 1,681 1 1,682
Private equity assets — — 155 155
Real assets — — 81 81
Securities lending collateral 6 189 — 195
Futures Contracts 1 — — 1
Total plan net assets at fair value $2,289 $4,368 $252 $ 6,909
Other assets (liabilities)1 (238)
Total Plan Net Assets $6,671
1 Other assets (liabilities) include amounts receivable, accounts payable and net adjustment for securities lending payable.