AT&T Wireless 2015 Annual Report Download - page 21
Download and view the complete annual report
Please find page 21 of the 2015 AT&T Wireless annual report below. You can navigate through the pages in the report by either clicking on the pages listed below, or by using the keyword search tool below to find specific information within the annual report.-
 1
1 -
2
-
3
-
4
-
5
-
6
-
7
-
8
-
9
-
10
-
 11
11 -
 12
12 -
 13
13 -
 14
14 -
 15
15 -
 16
16 -
 17
17 -
 18
18 -
 19
19 -
 20
20 -
 21
21 -
 22
22 -
 23
23 -
 24
24 -
 25
25 -
 26
26 -
 27
27 -
 28
28 -
 29
29 -
 30
30 -
 31
31 -
32
-
33
-
34
-
35
-
36
-
37
-
38
-
39
-
40
-
41
-
42
-
43
-
44
-
45
-
46
-
47
-
48
-
49
-
50
-
51
-
52
-
53
-
54
-
55
-
56
-
57
-
58
-
59
-
60
-
61
-
62
-
63
-
64
-
65
-
66
-
67
-
68
-
69
-
70
-
71
-
72
-
73
-
74
-
75
-
76
-
77
-
78
-
79
-
80
-
81
-
82
-
83
-
84
-
85
-
86
-
87
-
88
 |
 |

AT&T INC.
|
19
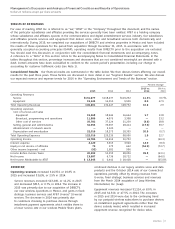
• Other cost of service decreased $209 primarily due
to incollect roaming fee rate declines, which were
partially offset by increased data volume.
Increased operations and support expenses in 2014
were primarily due to the following:
• Equipment costs increased $613, reflecting
increased sales and customers choosing more
expensive smartphones.
• Handset insurance cost increased $283 due to
an increase in the cost of replacement phones.
• Network costs increased $222 due to increased lease
fees, higher maintenance and energy costs resulting from
the increase in the number of cell sites and expenses
related to our network enhancement efforts. These
increases were partially offset by lower interconnect
costs resulting from our ongoing network transition to
more efficient Ethernet/IP-based technologies.
• Other cost of service increased $190 primarily due
to equipment/device service-related costs associated
with home monitoring services and higher incollect
roaming costs resulting from increased data volume,
which was partially due to the acquisition of Leap.
These increases were partially offset by incollect
roaming fee rate declines.
Partially offsetting these increases in 2014 were lower
selling and commission expenses of $253, which were
primarily due to lower average commission rates, including
those paid under the AT&T Next program.
Depreciation expense increased $24, or 0.6%, in 2015
and $144, or 3.9%, in 2014. The increase in 2015 was
primarily due to ongoing capital spending for network
upgrades and expansion that was largely offset by fully
depreciated assets. The increase in 2014 was primarily
due to ongoing capital spending for network upgrades
and expansion, as well as the acquisition of Leap partially
offset by fully depreciated assets and extending the
estimated useful life of software.
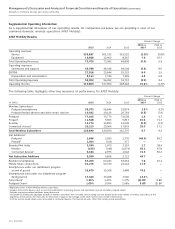
Operating income increased $687, or 7.6%, in 2015
and decreased $964, or 9.6%, in 2014. Our Consumer
Mobility segment operating income margin was 27.8%
in 2015, compared to 24.6% in 2014 and 27.6% in 2013.
Our Consumer Mobility EBITDA margin was 38.8% in 2015,
compared to 35.0% in 2014 and 37.8% in 2013.
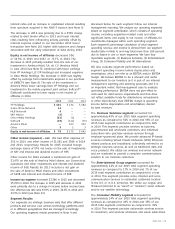
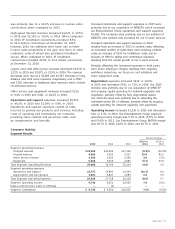
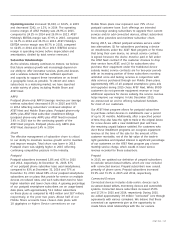
International
Segment Results
Percent Change
2015 vs. 2014 vs.
2015 2014 2013 2014 2013
Segment operating revenues
Video entertainment $2,150 $ — $ — — —
Wireless 1,647 — — — —
Equipment 305 — — — —
Total Segment Operating Revenues 4,102 — — — —
Segment operating expenses
Operations and support 3,930 — — — —
Depreciation and amortization 655 — — — —
Total Segment Operating Expenses 4,585 — — — —
Segment Operating Income (Loss) (483) — — — —
Equity in Net Income (Loss) of Affiliates (5) 153 532 — (71.2)
Segment Contribution $ (488) $153 $532 — (71.2)%
Operating Results
Our International segment consists of the Latin America
operations acquired in our July 2015 acquisition of DIRECTV
as well as the Mexican wireless operations acquired earlier
in 2015 (see Note 7). For 2015, our International segment
operating income margin was (11.8)% and our International
EBITDA margin was 4.2%.
Our 2015 operating revenues were $4,102, with $1,952
attributable to wireless revenues in Mexico and $2,150
in video services in Latin America. Operations and support
expenses consist of costs incurred to provide our products
and services, including costs of operating and maintaining
our networks, providing video content and personnel
costs, such as compensation and benefits. Our 2015
operating expenses were $3,930 and operating loss
was $483.
Connections Summary
At December 31, 2015, we had approximately 8.7 million
wireless subscribers in Mexico and 12.5 million video
connections in Latin America, including 5.4 million
in Brazil. Since acquisition, our Mexico wireless business
had a net loss of 96,000 subscribers, mainly prepaid
customers, and our Latin America operations had
a net loss of 147,000 video connections.