AT&T Wireless 2015 Annual Report Download - page 15
Download and view the complete annual report
Please find page 15 of the 2015 AT&T Wireless annual report below. You can navigate through the pages in the report by either clicking on the pages listed below, or by using the keyword search tool below to find specific information within the annual report.-
 1
1 -
2
-
3
-
4
-
 5
5 -
 6
6 -
 7
7 -
 8
8 -
 9
9 -
 10
10 -
 11
11 -
 12
12 -
 13
13 -
 14
14 -
 15
15 -
 16
16 -
 17
17 -
 18
18 -
 19
19 -
 20
20 -
 21
21 -
 22
22 -
 23
23 -
 24
24 -
 25
25 -
26
-
27
-
28
-
29
-
30
-
31
-
32
-
33
-
34
-
35
-
36
-
37
-
38
-
39
-
40
-
41
-
42
-
43
-
44
-
45
-
46
-
47
-
48
-
49
-
50
-
51
-
52
-
53
-
54
-
55
-
56
-
57
-
58
-
59
-
60
-
61
-
62
-
63
-
64
-
65
-
66
-
67
-
68
-
69
-
70
-
71
-
72
-
73
-
74
-
75
-
76
-
77
-
78
-
79
-
80
-
81
-
82
-
83
-
84
-
85
-
86
-
87
-
88
 |
 |

AT&T INC.
|
13
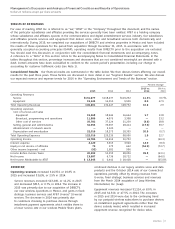
discussed below for each segment follow our internal
management reporting. We analyze our operating segments
based on segment contribution, which consists of operating
income, excluding acquisition-related costs and other
significant items, and equity in net income of affiliates for
investments managed within each operating segment.
Each segment’s percentage calculation of total segment
operating revenue and income is derived from our segment
results table in Note 4, and may total more than 100percent
due to losses in one or more segments. We have four
reportable segments: (1) Business Solutions, (2)Entertainment
Group, (3)Consumer Mobility and (4)International.
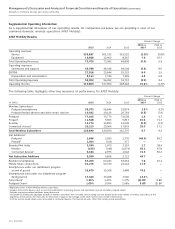
We also evaluate segment performance based on
segment operating income before depreciation and
amortization, which we refer to as EBITDA and/or EBITDA
margin. We believe EBITDA to be a relevant and useful
measurement to our investors as it is part of our internal
management reporting and planning processes and it is
an important metric that management uses to evaluate
operating performance. EBITDA does not give effect to
cash used for debt service requirements and thus does
not reflect available funds for distributions, reinvestment
or other discretionary uses. EBITDA margin is operating
income before depreciation and amortization, divided
by total revenues.
The Business Solutions segment accounted for
approximately 49% of our 2015 total segment operating
revenues as compared to 54% in 2014 and 59% of our
2015 total segment contribution as compared to 66%
in 2014. This segment provides services to business,
governmental and wholesale customers, and individual
subscribers who purchase wireless services through
employer-sponsored plans. We provide advanced IP-based
services including Virtual Private Networks (VPN), Ethernet-
related products and broadband, collectively referred to as
strategic business services, as well as traditional data and
voice products. We utilize our wireless and wired network
and are marketed to provide a complete communications
solution to our business customers.
The Entertainment Group segment accounted for
approximately 24% of our 2015 total segment operating
revenues as compared to 17% in 2014 and 7% of our
2015 total segment contribution as compared to a loss
in 2014. This segment provides video, Internet and voice
communication services to residential customers located
in the U.S. or in U.S. territories. We utilize our copper and
IP-based (referred to as “wired” or “wireline”) wired network
and/or our satellite technology.
The Consumer Mobility segment accounted for
approximately 24% of our 2015 total segment operating
revenues as compared to 28% in 2014 and 35% of our
2015 total segment contribution as compared to 39%
in 2014. This segment provides nationwide wireless service
to consumers, and wireless wholesale and resale subscribers
interest rates and an increase in capitalized interest resulting
from spectrum acquired in the AWS-3 Auction (see Note 5).
The decrease in 2014 was primarily due to a $581 charge
related to debt tender offers in 2013 and lower interest
rates resulting from refinancing activity, partially offset by
interest expense related to our December 2013 tower
transaction (see Note 16), higher debt balances and charges
associated with the early redemption of debt during 2014.
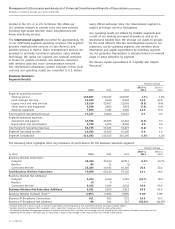
Equity in net income of affiliates decreased $96,
or 54.9%, in 2015 and $467, or 72.7%, in 2014. The
decrease in 2015 primarily resulted from the sale of our
investment in América Móvil, S.A. de C.V. (América Móvil)
in June 2014 (see Note5), combined with lower earnings
from YP Holdings LLC (YPHoldings) and increased expenses
in Otter Media Holdings. The decrease in 2015 was slightly
offset by earnings from investments acquired in our purchase
of DIRECTV (see Note8). The sale of the investment in
América Móvil, lower earnings from YP Holdings and our
investment in the mobile payment joint venture SoftcardTM
(Softcard) contributed to lower equity in net income of
affiliates in 2014.
2015 2014 2013
YP Holdings $ 101 $ 134 $ 182
Game Show Network 14 — —
MLB Network 9 — —
SKY Mexico (2) — —
Otter Media Holdings (31) (2) —
Softcard (15) (112) (75)
América Móvil — 153 532
Other 3 2 3
Equity in net income of affiliates $ 79 $ 175 $ 642
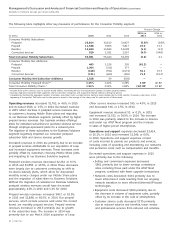
Other income (expense) – net We had other expense of
$52 in 2015, and other income of $1,581 and $596 in 2014
and 2013, respectively. Results for 2015 included foreign
exchange losses of $74, net losses on the sale of investments
of $87 and interest and dividend income of $95.
Other income for 2014 included a combined net gain of
$1,470 on the sale of América Móvil shares, our Connecticut
operations and other investments and interest and dividend
income of $68. Results for 2013 included a net gain on
the sale of América Móvil shares and other investments
of $498 and interest and dividend income of $68.
Income tax expense increased $3,386 in 2015 and decreased
$5,709 in 2014. The increase in 2015 and decrease in 2014
were primarily due to a change in income before income taxes.
Our effective tax rate was 33.9% in 2015, 34.9% in 2014 and
33.3% in 2013 (see Note 11).
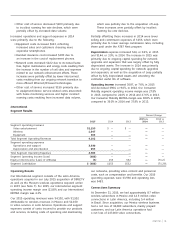
Segment Results
Our segments are strategic business units that offer different
products and services over various technology platforms and/
or in different geographies that are managed accordingly.
Our operating segment results presented in Note 4 and