AT&T Wireless 2015 Annual Report Download - page 56
Download and view the complete annual report
Please find page 56 of the 2015 AT&T Wireless annual report below. You can navigate through the pages in the report by either clicking on the pages listed below, or by using the keyword search tool below to find specific information within the annual report.-
 1
1 -
2
-
3
-
4
-
5
-
6
-
7
-
8
-
9
-
10
-
11
-
12
-
13
-
14
-
15
-
16
-
17
-
18
-
19
-
20
-
21
-
22
-
23
-
24
-
25
-
26
-
27
-
28
-
29
-
30
-
31
-
32
-
33
-
34
-
35
-
36
-
37
-
38
-
39
-
40
-
41
-
42
-
43
-
44
-
45
-
 46
46 -
 47
47 -
 48
48 -
 49
49 -
 50
50 -
 51
51 -
 52
52 -
 53
53 -
 54
54 -
 55
55 -
 56
56 -
 57
57 -
 58
58 -
 59
59 -
 60
60 -
 61
61 -
 62
62 -
 63
63 -
 64
64 -
 65
65 -
 66
66 -
67
-
68
-
69
-
70
-
71
-
72
-
73
-
74
-
75
-
76
-
77
-
78
-
79
-
80
-
81
-
82
-
83
-
84
-
85
-
86
-
87
-
88
 |
 |

Notes to Consolidated Financial Statements (continued)
Dollars in millions except per share amounts
54
|
AT&T INC.
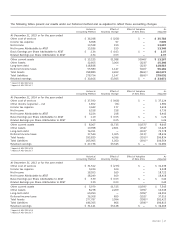
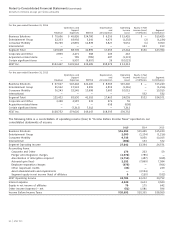
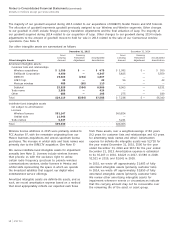
For the year ended December 31, 2014
Operations and Depreciation Operating Equity in Net
Support and Income Income (Loss) Segment
Revenue Expenses EBITDA Amortization (Loss) of Affiliates Contribution
Business Solutions $ 70,606 $ 45,826 $24,780 $ 9,355 $ 15,425 $ — $15,425
Entertainment Group 22,233 18,992 3,241 4,473 (1,232) (2) (1,234)
Consumer Mobility 36,769 23,891 12,878 3,827 9,051 (1) 9,050
International — — — — — 153 153
Segment Total 129,608 88,709 40,899 17,655 23,244 $150 $23,394
Corporate and Other 2,839 2,471 368 105 263
Acquisition-related items — 785 (785) 487 (1,272)
Certain significant items — 9,997 (9,997) 26 (10,023)
AT&T Inc. $132,447 $101,962 $30,485 $18,273 $ 12,212
For the year ended December 31, 2013
Operations and Depreciation Operating Equity in Net
Support and Income Income (Loss) Segment
Revenue Expenses EBITDA Amortization (Loss) of Affiliates Contribution
Business Solutions $ 67,647 $43,442 $24,205 $ 8,965 $15,240 $ — $15,240
Entertainment Group 21,542 17,943 3,599 4,815 (1,216) — (1,216)
Consumer Mobility 36,243 22,545 13,698 3,683 10,015 — 10,015
International — — — — — 532 532
Segment Total 125,432 83,930 41,502 17,463 24,039 $532 $24,571
Corporate and Other 3,320 2,987 333 274 59
Acquisition-related items — — — 658 (658)
Certain significant items — (7,312) 7,312 — 7,312
AT&T Inc. $128,752 $79,605 $49,147 $18,395 $30,752
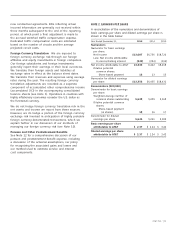
The following table is a reconciliation of operating income (loss) to “Income Before Income Taxes” reported on our
consolidated statements of income:
2015 2014 2013
Business Solutions $16,392 $15,425 $15,240
Entertainment Group 2,000 (1,234) (1,216)
Consumer Mobility 9,738 9,050 10,015
International (488) 153 532
Segment Operating Income 27,642 23,394 24,571
Reconciling Items:
Corporate and Other 176 263 59
Merger and integration charges (2,072) (785) —
Amortization of intangibles acquired (2,712) (487) (658)
Actuarial gain (loss) 2,152 (7,869) 7,584
Employee separation charges (375) — (501)
Other (expenses) credits (35) — 229
Asset abandonments and impairments — (2,154) —
Segment equity in net income (loss) of affiliates 9 (150) (532)
AT&T Operating Income 24,785 12,212 30,752
Interest expense 4,120 3,613 3,940
Equity in net income of affiliates 79 175 642
Other income (expense) – net (52) 1,581 596
Income Before Income Taxes $20,692 $10,355 $28,050