AT&T Wireless 2015 Annual Report Download - page 69
Download and view the complete annual report
Please find page 69 of the 2015 AT&T Wireless annual report below. You can navigate through the pages in the report by either clicking on the pages listed below, or by using the keyword search tool below to find specific information within the annual report.-
 1
1 -
2
-
3
-
4
-
5
-
6
-
7
-
8
-
9
-
10
-
11
-
12
-
13
-
14
-
15
-
16
-
17
-
18
-
19
-
20
-
21
-
22
-
23
-
24
-
25
-
26
-
27
-
28
-
29
-
30
-
31
-
32
-
33
-
34
-
35
-
36
-
37
-
38
-
39
-
40
-
41
-
42
-
43
-
44
-
45
-
46
-
47
-
48
-
49
-
50
-
51
-
52
-
53
-
54
-
55
-
56
-
57
-
58
-
 59
59 -
 60
60 -
 61
61 -
 62
62 -
 63
63 -
 64
64 -
 65
65 -
 66
66 -
 67
67 -
 68
68 -
 69
69 -
 70
70 -
 71
71 -
 72
72 -
 73
73 -
 74
74 -
 75
75 -
 76
76 -
 77
77 -
 78
78 -
 79
79 -
80
-
81
-
82
-
83
-
84
-
85
-
86
-
87
-
88
 |
 |

AT&T INC.
|
67
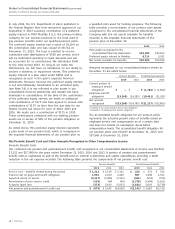
conditions, government actions, marketplace changes and
the general consumer inflation rate.
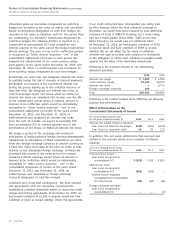
In the fourth quarter of 2014, we changed the method we
use to estimate the service and interest components of net
periodic benefit cost for pension (as of October 1, 2014)
and other postretirement benefits (as of December 31, 2014).
This change did not affect the measurement of our total
benefit obligations or our annual net periodic benefit cost
as the change in service and interest costs was completely
offset in the actuarial (gain) loss reported. This change
compared to the previous method resulted in a decrease of
$150 in the service and interest components for pension
cost in the fourth quarter of 2014. For the year ended
December 31, 2015, the change resulted in an incremental
decrease of $740 in service and interest components for
pension and postretirement costs. Prior to the fourth quarter
of 2014, we estimated these service and interest cost
components utilizing a single weighted-average discount rate
derived from the yield curve used to measure the benefit
obligation at the beginning of the period. We have elected
to utilize a full yield curve approach in the estimation of
these components by applying the specific spot rates along
the yield curve used in the determination of the benefit
obligation to the relevant projected cash flows. We have
made this change to provide a more precise measurement
of service and interest costs by improving the correlation
between projected benefit cash flows to the corresponding
spot yield curve rates. We have accounted for this change
as a change in accounting estimate that is inseparable from
a change in accounting principle and accordingly have
accounted for it prospectively.
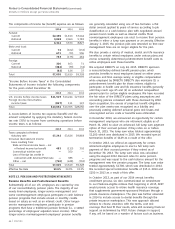
Obligations and Funded Status
For defined benefit pension plans, the benefit obligation is
the “projected benefit obligation,” the actuarial present value,
as of our December 31 measurement date, of all benefits
attributed by the pension benefit formula to employee service
rendered to that date. The amount of benefit to be paid
depends on a number of future events incorporated into the
pension benefit formula, including estimates of the average
life of employees/survivors and average years of service
rendered. It is measured based on assumptions concerning
future interest rates and future employee compensation levels.
For postretirement benefit plans, the benefit obligation is the
“accumulated postretirement benefit obligation,” the actuarial
present value as of a date of all future benefits attributed
under the terms of the postretirement benefit plan to
employee service rendered to the valuation date.
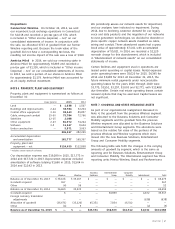
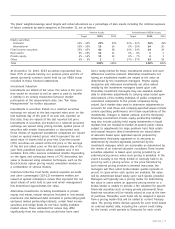
The following table presents this reconciliation and shows the change in the projected benefit obligation for the years ended
December 31:
Pension Benefits Postretirement Benefits
2015 2014 2015 2014
Benefit obligation at beginning of year $59,543 $56,560 $30,709 $30,285
Service cost – benefits earned during the period 1,212 1,134 222 233
Interest cost on projected benefit obligation 1,902 2,470 967 1,458
Amendments (8) (73) (74) (617)
Actuarial (gain) loss (3,079) 6,269 (1,988) 1,822
Special termination benefits 149 17 — —
Benefits paid (4,681) (6,543) (1,958) (2,298)
DIRECTV acquisition 470 — 20 —
Transfer for sale of Connecticut wireline operations (42) (293) — (174)
Plan transfers (2) 2 — —
Benefit obligation at end of year $55,464 $59,543 $27,898 $30,709
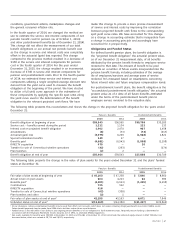
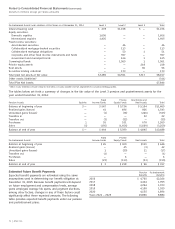
The following table presents the change in the value of plan assets for the years ended December 31 and the plans’ funded
status at December 31:
Pension Benefits Postretirement Benefits
2015 2014 2015 2014
Fair value of plan assets at beginning of year $ 45,163 $ 47,238 $ 7,846 $ 8,960
Actual return on plan assets 604 4,213 64 384
Benefits paid1 (4,681) (6,543) (1,239) (1,498)
Contributions 735 562 — —
DIRECTV acquisition 418 — — —
Transfer for sale of Connecticut wireline operations (42) (308) — —
Plan transfers and other (2) 1 — —
Fair value of plan assets at end of year3 42,195 45,163 6,671 7,846
Unfunded status at end of year2 $(13,269) $(14,380) $(21,227) $(22,863)
1 At our discretion, certain postretirement benefits may be paid from AT&T cash accounts, which does not reduce Voluntary Employee Benefit Association (VEBA) assets.
Future benefit payments may be made from VEBA trusts and thus reduce those asset balances.
2 Funded status is not indicative of our ability to pay ongoing pension benefits or of our obligation to fund retirement trusts. Required pension funding is determined in
accordance with the Employee Retirement Income Security Act of 1974, as amended (ERISA) regulations.
3 Net assets available for benefits were $50,909 at December 31, 2015 and $54,184 at December 31, 2014 and include the preferred equity interest in AT&T Mobility II LLC
discussed below, which was valued at $8,714 and $9,021, respectively.