AT&T Wireless 2015 Annual Report Download - page 76
Download and view the complete annual report
Please find page 76 of the 2015 AT&T Wireless annual report below. You can navigate through the pages in the report by either clicking on the pages listed below, or by using the keyword search tool below to find specific information within the annual report.-
 1
1 -
2
-
3
-
4
-
5
-
6
-
7
-
8
-
9
-
10
-
11
-
12
-
13
-
14
-
15
-
16
-
17
-
18
-
19
-
20
-
21
-
22
-
23
-
24
-
25
-
26
-
27
-
28
-
29
-
30
-
31
-
32
-
33
-
34
-
35
-
36
-
37
-
38
-
39
-
40
-
41
-
42
-
43
-
44
-
45
-
46
-
47
-
48
-
49
-
50
-
51
-
52
-
53
-
54
-
55
-
56
-
57
-
58
-
59
-
60
-
61
-
62
-
63
-
64
-
65
-
 66
66 -
 67
67 -
 68
68 -
 69
69 -
 70
70 -
 71
71 -
 72
72 -
 73
73 -
 74
74 -
 75
75 -
 76
76 -
 77
77 -
 78
78 -
 79
79 -
 80
80 -
 81
81 -
 82
82 -
 83
83 -
 84
84 -
 85
85 -
 86
86 -
87
-
88
 |
 |

Notes to Consolidated Financial Statements (continued)
Dollars in millions except per share amounts
74
|
AT&T INC.
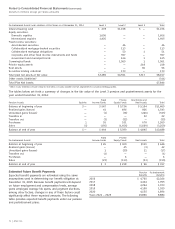
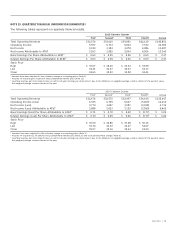
Postretirement Assets and Liabilities at Fair Value as of December 31, 2014 Level 1 Level 2 Level 3 Total
Interest bearing cash $ 278 $1,198 $ — $1,476
Equity securities:
Domestic equities 1,606 — — 1,606
International equities 1,405 — — 1,405
Fixed income securities:
Asset-backed securities — 46 — 46
Collateralized mortgage-backed securities — 113 — 113
Collateralized mortgage obligations — 50 1 51
Corporate and other fixed income instruments and funds — 397 — 397
Government and municipal bonds — 614 1 615
Commingled funds — 1,960 1 1,961
Private equity assets — — 218 218
Real assets — — 96 96
Securities lending collateral — 173 — 173
Total plan net assets at fair value $3,289 $4,551 $317 $8,157
Other assets (liabilities)1 (311)
Total Plan Net Assets $7,846
1 Other assets (liabilities) include amounts receivable, accounts payable and net adjustment for securities lending payable.
The tables below set forth a summary of changes in the fair value of the Level 3 pension and postretirement assets for the
year ended December 31, 2014:
Fixed Private Real Estate and
Pension Assets Equities Income Funds Equity Funds Real Assets Total
Balance at beginning of year $ — $ 547 $ 5,724 $ 5,194 $11,465
Realized gains (losses) — 41 696 806 1,543
Unrealized gains (losses) — (1) (76) (246) (323)
Transfers in — — — 22 22
Transfers out — (3) (22) — (25)
Purchases 1 55 531 678 1,265
Sales (1) (195) (1,454) (1,609) (3,259)
Balance at end of year $ — $ 444 $ 5,399 $ 4,845 $10,688
Fixed Private
Postretirement Assets Income Funds Equity Funds Real Assets Total
Balance at beginning of year $ 26 $ 309 $111 $ 446
Realized gains (losses) — 45 (3) 42
Unrealized gains (losses) 1 (29) 11 (17)
Transfers out (1) — — (1)
Purchases — 6 — 6
Sales (23) (113) (23) (159)
Balance at end of year $ 3 $ 218 $ 96 $ 317
Estimated Future Benefit Payments
Expected benefit payments are estimated using the same
assumptions used in determining our benefit obligation at
December 31, 2015. Because benefit payments will depend
on future employment and compensation levels, average
years employed, average life spans, and payment elections,
among other factors, changes in any of these factors could
significantly affect these expected amounts. The following
table provides expected benefit payments under our pension
and postretirement plans:
Pension Postretirement
Benefits Benefits
2016 $ 4,705 $2,024
2017 4,424 1,995
2018 4,294 1,973
2019 4,198 1,939
2020 4,155 1,894
Years 2021 – 2025 19,886 8,884