AT&T Wireless 2015 Annual Report Download - page 19
Download and view the complete annual report
Please find page 19 of the 2015 AT&T Wireless annual report below. You can navigate through the pages in the report by either clicking on the pages listed below, or by using the keyword search tool below to find specific information within the annual report.-
 1
1 -
2
-
3
-
4
-
5
-
6
-
7
-
8
-
 9
9 -
 10
10 -
 11
11 -
 12
12 -
 13
13 -
 14
14 -
 15
15 -
 16
16 -
 17
17 -
 18
18 -
 19
19 -
 20
20 -
 21
21 -
 22
22 -
 23
23 -
 24
24 -
 25
25 -
 26
26 -
 27
27 -
 28
28 -
 29
29 -
30
-
31
-
32
-
33
-
34
-
35
-
36
-
37
-
38
-
39
-
40
-
41
-
42
-
43
-
44
-
45
-
46
-
47
-
48
-
49
-
50
-
51
-
52
-
53
-
54
-
55
-
56
-
57
-
58
-
59
-
60
-
61
-
62
-
63
-
64
-
65
-
66
-
67
-
68
-
69
-
70
-
71
-
72
-
73
-
74
-
75
-
76
-
77
-
78
-
79
-
80
-
81
-
82
-
83
-
84
-
85
-
86
-
87
-
88
 |
 |

AT&T INC.
|
17
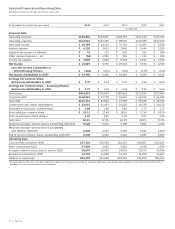
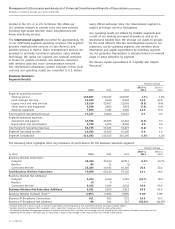
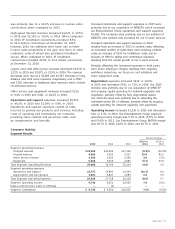
Consumer Mobility
Segment Results
Percent Change
2015 vs. 2014 vs.
2015 2014 2013 2014 2013
Segment operating revenues
Postpaid wireless $22,030 $24,282 $27,140 (9.3)% (10.5)%
Prepaid wireless 4,662 4,205 2,317 10.9 81.5
Other service revenue 2,458 2,363 2,399 4.0 (1.5)
Equipment 5,916 5,919 4,387 (0.1) 34.9
Total Segment Operating Revenues 35,066 36,769 36,243 (4.6) 1.5
Segment operating expenses
Operations and support 21,477 23,891 22,545 (10.1) 6.0
Depreciation and amortization 3,851 3,827 3,683 0.6 3.9
Total Segment Operating Expenses 25,328 27,718 26,228 (8.6) 5.7
Segment Operating Income 9,738 9,051 10,015 7.6 (9.6)
Equity in Net Income (Loss) of Affiliates — (1) — — —
Segment Contribution $ 9,738 $ 9,050 $10,015 7.6% (9.6)%
Increased operations and support expenses in 2015 were
primarily due to our acquisition of DIRECTV, which increased
our Entertainment Group operations and support expenses
$9,683. The increases were primarily due to our addition of
DIRECTV and content cost increases for our U-verse services.
Increased operations and support expenses in 2014
resulted from an increase of $763 in content costs, reflecting
an increased number of subscribers and increasing content
costs; an increase of $192 for installation costs; and an
increase of $90 for selling and commission expenses
resulting from the overall growth of our U-verse services.
Partially offsetting the increased expenses in both years
were lower employee charges resulting from ongoing
workforce reductions, our focus on cost initiatives and
lower equipment costs.
Depreciation expenses increased $472, or 10.6%,
in 2015 and decreased $342, or 7.1%, in 2014. Our 2015
increase was primarily due to our acquisition of DIRECTV
and ongoing capital spending for network upgrades and
expansion, partially offset by fully depreciated assets.
Our 2014 decrease was primarily due to extending the
estimated useful life of software, partially offset by ongoing
capital spending for network upgrades and expansion.
Operating income increased $3,236 in 2015 and decreased
$16, or 1.3%, in 2014. Our Entertainment Group segment
operating income margin was 5.7% in 2015, (5.5)% in 2014,
and (5.6)% in 2013. Our Entertainment Group EBITDA margin
was 19.7% in 2015, 14.6% in 2014, and 16.7% in 2013.
was primarily due to a 12.6% increase in U-verse video
connections, when compared to 2013.
High-speed Internet revenues increased $1,079, or 19.5%,
in 2015 and $1,303, or 30.9%, in 2014. When compared
to 2014, IP broadband connections increased 8.5%,
to 12.4million connections at December 31, 2015;
however, 2015 net additions were lower due to fewer
U-verse sales promotions in the year and churn of video
customers, some of whom also purchased broadband
service. When compared to 2013, IP broadband
connections increased 20.0%, to 11.4million connections
at December 31, 2014.
Legacy voice and data service revenues decreased $1,678, or
22.1%, in 2015 and $2,075, or 21.5%, in 2014. The revenue
decreases were due to a $1,083 and $1,367 decrease in long-
distance and local voice revenues, respectively, and a $593
and $710 decrease in traditional data revenues, which include
circuit-based services.
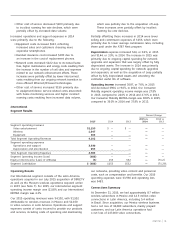
Other service and equipment revenues increased $215,
or 9.4%, in 2015 and $447, or 24.2%, in 2014.
Operations and support expenses increased $9,353,
or 49.2%, in 2015 and $1,049, or 5.8%, in 2014.
Operations and support expenses consist of costs
incurred to provide our products and services, including
costs of operating and maintaining our networks,
providing video content and personnel costs, such
as compensation and benefits.