AT&T Wireless 2015 Annual Report Download - page 71
Download and view the complete annual report
Please find page 71 of the 2015 AT&T Wireless annual report below. You can navigate through the pages in the report by either clicking on the pages listed below, or by using the keyword search tool below to find specific information within the annual report.-
 1
1 -
2
-
3
-
4
-
5
-
6
-
7
-
8
-
9
-
10
-
11
-
12
-
13
-
14
-
15
-
16
-
17
-
18
-
19
-
20
-
21
-
22
-
23
-
24
-
25
-
26
-
27
-
28
-
29
-
30
-
31
-
32
-
33
-
34
-
35
-
36
-
37
-
38
-
39
-
40
-
41
-
42
-
43
-
44
-
45
-
46
-
47
-
48
-
49
-
50
-
51
-
52
-
53
-
54
-
55
-
56
-
57
-
58
-
59
-
60
-
 61
61 -
 62
62 -
 63
63 -
 64
64 -
 65
65 -
 66
66 -
 67
67 -
 68
68 -
 69
69 -
 70
70 -
 71
71 -
 72
72 -
 73
73 -
 74
74 -
 75
75 -
 76
76 -
 77
77 -
 78
78 -
 79
79 -
 80
80 -
 81
81 -
82
-
83
-
84
-
85
-
86
-
87
-
88
 |
 |

AT&T INC.
|
69
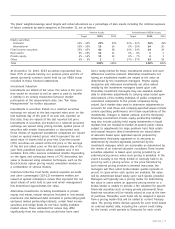
ended December 31, 2014, we decreased our pension
discount rate by 0.70%, resulting in an increase in our pension
plan benefit obligation of $4,854 and decreased our
postretirement discount rates by 0.80%, resulting in an
increase in our postretirement benefit obligation of $2,786.
We utilize a full yield curve approach in the estimation of the
service and interest components of net periodic benefit costs
for pension and other postretirement benefits. Under this
approach, we apply discounting using individual spot rates
from a yield curve composed of the rates of return on several
hundred high-quality, fixed income corporate bonds available
at the measurement date. These spot rates align to each of
the projected benefit obligations and service cost cash flows.
The service cost component relates to the active participants
in the plan, so the relevant cash flows on which to apply the
yield curve are considerably longer in duration on average
than the total projected benefit obligation cash flows, which
also include benefit payments to retirees. Interest cost is
computed by multiplying each spot rate by the corresponding
discounted projected benefit obligation cash flows. The full
yield curve approach reduces any actuarial gains and losses
based upon interest rate expectations (e.g., built-in gains in
interest cost in an upward sloping yield curve scenario), or
gains and losses merely resulting from the timing and
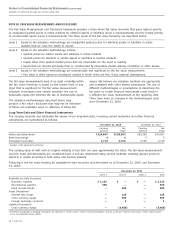
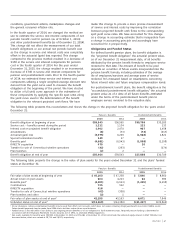
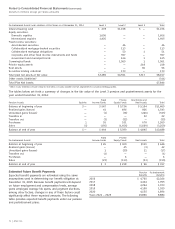
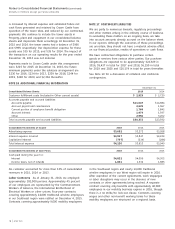
Other Changes in Benefit Obligations Recognized in Other Comprehensive Income
The following table presents the after-tax changes in benefit obligations recognized in OCI and the after-tax prior service
credits that were amortized from OCI into net periodic benefit costs:
Pension Benefits Postretirement Benefits
2015 2014 2013 2015 2014 2013
Balance at beginning of year $575 $583 $641 $6,257 $6,812 $4,766
Prior service (cost) credit 1 45 — 45 383 2,765
Amortization of prior service credit (64) (58) (58) (792) (898) (719)
Reclassification to income of prior service credit — 5 — — (40) —
Total recognized in other comprehensive (income) loss (63) (8) (58) (747) (555) 2,046
Balance at end of year $512 $575 $583 $5,510 $6,257 $6,812
The estimated prior service credits that will be amortized from accumulated OCI into net periodic benefit cost over the next
fiscal year are $103 ($64 net of tax) for pension and $1,277 ($792 net of tax) for postretirement benefits.
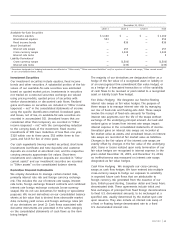
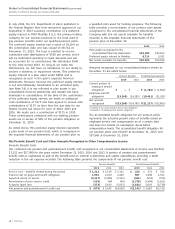
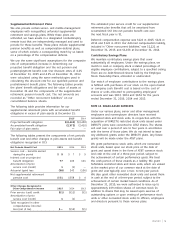
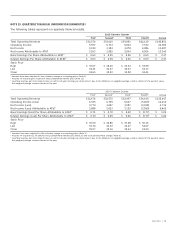
Assumptions
In determining the projected benefit obligation and the net pension and postretirement benefit cost, we used the following
significant weighted-average assumptions:
Pension Benefits Postretirement Benefits
2015 2014 2013 2015 2014 2013
Weighted-average discount rate for determining projected
benefit obligation at December 31 4.60% 4.30% 5.00% 4.50% 4.20% 5.00%
Discount rate in effect for determining service cost 4.60% 5.00% 4.30% 4.60% 5.00% 4.30%
Discount rate in effect for determining interest cost1 3.30% 4.60% 4.30% 3.30% 5.00% 4.30%
Long-term rate of return on plan assets 7.75% 7.75% 7.75% 5.75% 7.75% 7.75%
Composite rate of compensation increase for determining
projected benefit obligation 3.10% 3.00% 3.00% 3.10% 3.00% 3.00%
Composite rate of compensation increase for determining
net pension cost (benefit) 3.00% 3.00% 3.00% 3.00% 3.00% 3.00%
1 Weighted-average discount rate of 5.00% in effect for pension costs from January 1, 2014 through September 30, 2014. Discount rates in effect of 4.90% for service cost and
3.50% for interest cost from October 1, 2014 through December 31, 2014. A discount rate of 5.00% was used for postretirement costs for the year ended December 31, 2014.
We recognize gains and losses on pension and postretirement
plan assets and obligations immediately in our operating
results. These gains and losses are measured annually as of
December 31 and accordingly will be recorded during the
fourth quarter, unless earlier remeasurements are required.
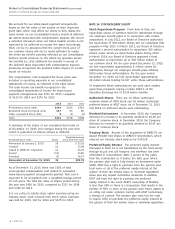
Discount Rate Our assumed weighted-average discount rate
for pension and postretirement benefits of 4.60% and 4.50%
respectively, at December 31, 2015, reflects the hypothetical
rate at which the projected benefit obligation could be
effectively settled or paid out to participants. We determined
our discount rate based on a range of factors, including a
yield curve composed of the rates of return on several
hundred high-quality, fixed income corporate bonds available
at the measurement date and corresponding to the related
expected durations of future cash outflows. These bonds were
all rated at least Aa3 or AA- by one of the nationally
recognized statistical rating organizations, denominated in
U.S. dollars, and neither callable, convertible nor index linked.
For the year ended December 31, 2015, when compared
to the year ended December 31, 2014, we increased our
pension discount rate by 0.30%, resulting in a decrease in our
pension plan benefit obligation of $1,977 and increased our
postretirement discount rate 0.30%, resulting in a decrease
in our postretirement benefit obligation of $854. For the year