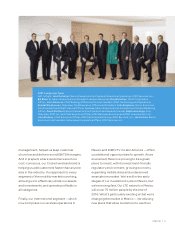
AT&T Wireless 2015 Annual Report Download - page 17
Download and view the complete annual report
Please find page 17 of the 2015 AT&T Wireless annual report below. You can navigate through the pages in the report by either clicking on the pages listed below, or by using the keyword search tool below to find specific information within the annual report.-
 1
1 -
2
-
3
-
4
-
5
-
6
-
 7
7 -
 8
8 -
 9
9 -
 10
10 -
 11
11 -
 12
12 -
 13
13 -
 14
14 -
 15
15 -
 16
16 -
 17
17 -
 18
18 -
 19
19 -
 20
20 -
 21
21 -
 22
22 -
 23
23 -
 24
24 -
 25
25 -
 26
26 -
 27
27 -
28
-
29
-
30
-
31
-
32
-
33
-
34
-
35
-
36
-
37
-
38
-
39
-
40
-
41
-
42
-
43
-
44
-
45
-
46
-
47
-
48
-
49
-
50
-
51
-
52
-
53
-
54
-
55
-
56
-
57
-
58
-
59
-
60
-
61
-
62
-
63
-
64
-
65
-
66
-
67
-
68
-
69
-
70
-
71
-
72
-
73
-
74
-
75
-
76
-
77
-
78
-
79
-
80
-
81
-
82
-
83
-
84
-
85
-
86
-
87
-
88
 |
 |

AT&T INC.
|
15
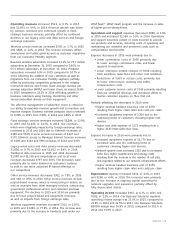
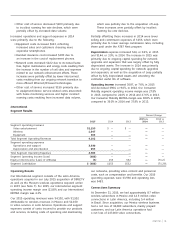
AT&T NextSM (AT&T Next) program and the increase in sales
of higher-priced smartphones.
Operations and support expenses decreased $880, or 1.9%,
in 2015 and increased $2,384, or 5.5%, in 2014. Operations
and support expenses consist of costs incurred to provide
our products and services, including costs of operating and
maintaining our networks and personnel costs, such as
compensation and benefits.
Expense decreases in 2015 were primarily due to:
• Lower commission costs of $995 primarily due
to lower average commission rates and fewer
upgrade transactions.
• Lower employee-related charges of $508 resulting
from workforce reductions and other cost initiatives.
• Reductions of $269 in access costs, primarily due
to lower interconnect, roaming and traffic
compensation costs.
• Lower customer service costs of $146 primarily resulting
from our simplified offerings and increased efforts to
resolve customer inquiries on their first call.
Partially offsetting the decreases in 2015 were:
• Higher wireless handset insurance cost of $370
resulting from higher claim rates and costs per claim.
• Increased equipment expense of $304 due to the
continuing trend of customers choosing higher-cost
devices.
• Higher bad debt expense of $173 resulting from a
higher AT&T Next subscriber base.
Expense increases in 2014 were primarily due to:
• Increased equipment expense of $1,779 due to
increased sales and the continuing trend of
customers choosing higher-cost devices.
• Network system costs increased $315 due to increased
lease fees, higher maintenance and energy costs
resulting from the increase in the number of cell sites
and expenses related to our network enhancement efforts.
• Higher wireless handset insurance cost of $159
resulting from higher claim rates and costs per claim.
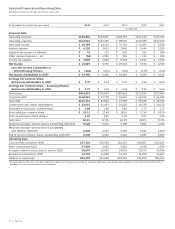
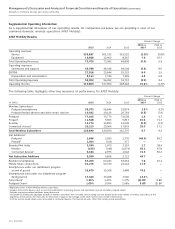
Depreciation expense increased $434, or 4.6%, in 2015
and $390, or 4.4%, in 2014. The increases were primarily
due to the increase in ongoing capital spending for
network upgrades and expansion partially offset by
fully depreciated assets.
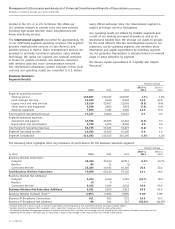
Operating income increased $967, or 6.3%, in 2015 and
$185, or 1.2%, in 2014. Our Business Solutions segment
operating income margin was 23.0% in 2015, compared to
21.8% in 2014 and 22.5% in 2013. Our Business Solutions
EBITDA margin was 36.8% in 2015, compared to 35.1% in
2014 and 35.8% in 2013.
Operating revenues increased $521, or 0.7%, in 2015
and $2,959, or 4.4%, in 2014. Revenue growth was driven
by wireless revenues and continued growth in fixed
strategic business services, partially offset by continued
declines in our legacy voice and data services and foreign
exchange pressures.
Wireless service revenues increased $505, or 1.7%, in 2015
and $486, or 1.6%, in 2014. The revenue increases reflect
smartphone and tablet gains as well as customer migrations
from our Consumer Mobility segment.
Business wireless subscribers increased 13.1%, to 73.7million
subscribers at December 31, 2015 compared to 14.0%, to
65.1 million subscribers at December31,2014. Postpaid
subscribers increased 6.9% in 2015 compared to 10.7% in
2014 reflecting the addition of new customers as well as
migrations from our Consumer Mobility segment, partially
offset by continuing competitive pressures in the industry.
Connected devices, which have lower average revenue per
average subscriber (ARPU) and lower churn, increased 26.8%
in 2015 compared to 22.2% in 2014 reflecting growth in
business customers using tracking, monitoring and other
sensor-embedded devices on their equipment.
The effective management of subscriber churn is critical to
our ability to maximize revenue growth and to maintain and
improve margins. Business wireless postpaid churn increased
to 0.99% in 2015 from 0.90% in 2014 and 0.89% in 2013.
Fixed strategic services revenues increased $1,244, or 12.9%,
in 2015 and $1,222, or 14.5%, in 2014. Our revenues,
which were negatively impacted by foreign exchange rates,
increased in 2015 and 2014 due to: Ethernet increases of
$389 and $340, U-verse services increases of $247 and
$170, Ethernet access to Managed Internet Services increases
of $190 and $163 and VPN increases of $116 and $359.
Legacy wired voice and data service revenues decreased
$1,838, or 9.3%, in 2015 and $1,812, or 8.4%, in 2014.
Traditional data revenues in 2015 and 2014 decreased
$1,040 and $1,318 and long-distance and local voice
revenues decreased $797 and $475. The decreases were
primarily due to lower demand as customers continue
to shift to our more advanced IP-based offerings or
our competitors.
Other service revenues decreased $302, or 7.8%, in 2015
and $18, or 0.5%, in 2014. Other service revenues include
project-based revenue, which is nonrecurring in nature, as
well as revenues from other managed services, outsourcing,
government professional service and customer premises
equipment. The declines in 2015 and 2014 are primarily
due to lower project-based and equipment revenues,
as well as impacts from foreign exchange rates.
Wireless equipment revenues increased $912, or 13.0%,
in 2015 and $3,081, or 77.8%, in 2014. The increase was
primarily due to the increase in handsets sold under our