AT&T Wireless 2015 Annual Report Download - page 13
Download and view the complete annual report
Please find page 13 of the 2015 AT&T Wireless annual report below. You can navigate through the pages in the report by either clicking on the pages listed below, or by using the keyword search tool below to find specific information within the annual report.-
 1
1 -
2
-
 3
3 -
 4
4 -
 5
5 -
 6
6 -
 7
7 -
 8
8 -
 9
9 -
 10
10 -
 11
11 -
 12
12 -
 13
13 -
 14
14 -
 15
15 -
 16
16 -
 17
17 -
 18
18 -
 19
19 -
 20
20 -
 21
21 -
 22
22 -
 23
23 -
24
-
25
-
26
-
27
-
28
-
29
-
30
-
31
-
32
-
33
-
34
-
35
-
36
-
37
-
38
-
39
-
40
-
41
-
42
-
43
-
44
-
45
-
46
-
47
-
48
-
49
-
50
-
51
-
52
-
53
-
54
-
55
-
56
-
57
-
58
-
59
-
60
-
61
-
62
-
63
-
64
-
65
-
66
-
67
-
68
-
69
-
70
-
71
-
72
-
73
-
74
-
75
-
76
-
77
-
78
-
79
-
80
-
81
-
82
-
83
-
84
-
85
-
86
-
87
-
88
 |
 |

AT&T INC.
|
11
Management’s Discussion and Analysis of Financial Condition and Results of Operations
Dollars in millions except per share amounts
continued declines in our legacy wireline voice and data
products and the October 2014 sale of our Connecticut
operations, partially offset by strong revenues from
U-verse, fixed strategic business services and revenues
from the March 2014 acquisition of Leap Wireless
International, Inc. (Leap).
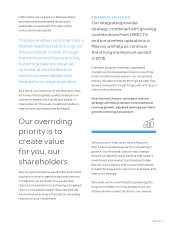
Equipment revenues increased $1,114, or 8.0%, in
2015 and $4,510, or 47.5%, in 2014. The increases
in 2015 and 2014 were due to the continuing trend
by our postpaid wireless subscribers to purchase devices
on installment payment agreements rather than the
device subsidy model, which resulted in increased
equipment revenue recognized for device sales.
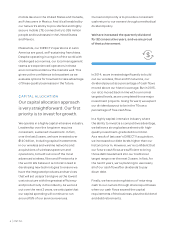
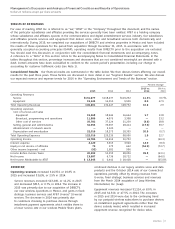
OVERVIEW
Operating revenues increased $14,354, or 10.8% in
2015 and increased $3,695, or 2.9% in 2014.
Service revenues increased $13,240, or 11.2%, in 2015
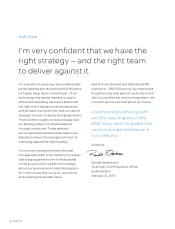
and decreased $815, or 0.7%, in 2014. The increase in
2015 was primarily due to our acquisition of DIRECTV,
our new wireless operations in Mexico, and gains in fixed
strategic business services and AT&T U-verse® (U-verse)
services. The decrease in 2014 was primarily due
to customers choosing to purchase devices through
installment payment agreements which entitles them to
a lower service rate in our wireless Mobile Share plans,
RESULTS OF OPERATIONS
For ease of reading, AT&T Inc. is referred to as “we,” “AT&T” or the “Company” throughout this document, and the names
of the particular subsidiaries and affiliates providing the services generally have been omitted. AT&T is a holding company
whose subsidiaries and affiliates operate in the communications and digital entertainment services industry. Our subsidiaries
and affiliates provide services and equipment that deliver voice, video and broadband services both domestically and
internationally. During 2015, we completed our acquisitions of DIRECTV and wireless properties in Mexico and have included
the results of those operations for the period from acquisition through December 31, 2015. In accordance with U.S.
generally accepted accounting principles (GAAP), operating results from DIRECTV prior to the acquisition are excluded.
You should read this discussion in conjunction with the consolidated financial statements and accompanying notes.
A reference to a “Note” in this section refers to the accompanying Notes to Consolidated Financial Statements. In the
tables throughout this section, percentage increases and decreases that are not considered meaningful are denoted with a
dash. Certain amounts have been reclassified to conform to the current period’s presentation, including our change in
accounting for customer fulfillment costs (see Note 1).
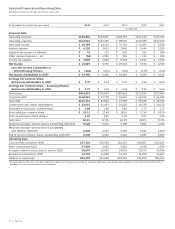
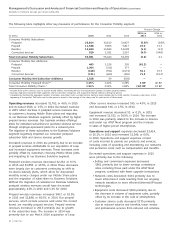
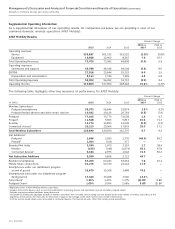
Consolidated Results Our financial results are summarized in the table below. We then discuss factors affecting our overall
results for the past three years. These factors are discussed in more detail in our “Segment Results” section. We also discuss
our expected revenue and expense trends for 2016 in the “Operating Environment and Trends of the Business” section.
Percent Change
2015 vs. 2014 vs.
2015 2014 2013 2014 2013
Operating Revenues
Service $131,677 $118,437 $119,252 11.2% (0.7)%
Equipment 15,124 14,010 9,500 8.0 47.5
Total Operating Revenues 146,801 132,447 128,752 10.8 2.9
Operating expenses
Cost of services and sales
Equipment 19,268 18,946 16,644 1.7 13.8
Broadcast, programming and operations 11,996 4,075 3,308 — 23.2
Other cost of services 35,782 37,124 31,239 (3.6) 18.8
Selling, general and administrative 32,954 39,697 28,414 (17.0) 39.7
Abandonment of network assets — 2,120 — — —
Depreciation and amortization 22,016 18,273 18,395 20.5 (0.7)
Total Operating Expenses 122,016 120,235 98,000 1.5 22.7
Operating Income 24,785 12,212 30,752 — (60.3)
Interest expense 4,120 3,613 3,940 14.0 (8.3)
Equity in net income of affiliates 79 175 642 (54.9) (72.7)
Other income (expense) – net (52) 1,581 596 — —
Income Before Income Taxes 20,692 10,355 28,050 99.8 (63.1)
Net Income 13,687 6,736 18,722 — (64.0)
Net Income Attributable to AT&T $ 13,345 $ 6,442 $ 18,418 — (65.0)%