AT&T Wireless 2015 Annual Report Download - page 12
Download and view the complete annual report
Please find page 12 of the 2015 AT&T Wireless annual report below. You can navigate through the pages in the report by either clicking on the pages listed below, or by using the keyword search tool below to find specific information within the annual report.
10
|
AT&T INC.
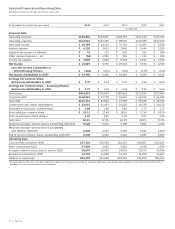
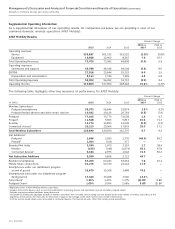
Selected Financial and Operating Data
Dollars in millions except per share amounts
At December 31 and for the year ended: 2015 20141 20131 20121 20111
As Adjusted
Financial Data
Operating revenues $146,801 $132,447 $128,752 $127,434 $126,723
Operating expenses $122,016 $120,235 $ 98,000 $114,380 $117,223
Operating income $ 24,785 $ 12,212 $ 30,752 $ 13,054 $ 9,500
Interest expense $ 4,120 $ 3,613 $ 3,940 $ 3,444 $ 3,535
Equity in net income of affiliates $ 79 $ 175 $ 642 $ 752 $ 784
Other income (expense) – net $ (52) $ 1,581 $ 596 $ 134 $ 249
Income tax expense $ 7,005 $ 3,619 $ 9,328 $ 2,922 $ 2,639
Net Income $ 13,687 $ 6,736 $ 18,722 $ 7,574 $ 4,359
Less: Net Income Attributable to
Noncontrolling Interest $ (342) $ (294) $ (304) $ (275) $ (240)
Net Income Attributable to AT&T $ 13,345 $ 6,442 $ 18,418 $ 7,299 $ 4,119
Earnings Per Common Share:
Net Income Attributable to AT&T $ 2.37 $ 1.24 $ 3.42 $ 1.26 $ 0.69
Earnings Per Common Share – Assuming Dilution:
Net Income Attributable to AT&T $ 2.37 $ 1.24 $ 3.42 $ 1.26 $ 0.69
Total assets $402,672 $296,834 $281,423 $275,834 $273,467
Long-term debt $118,515 $ 75,778 $ 69,091 $ 66,152 $ 61,091
Total debt $126,151 $ 81,834 $ 74,589 $ 69,638 $ 64,544
Construction and capital expenditures $ 20,015 $ 21,433 $ 21,228 $ 19,728 $ 20,272
Dividends declared per common share $ 1.89 $ 1.85 $ 1.81 $ 1.77 $ 1.73
Book value per common share $ 20.12 $ 17.40 $ 18.10 $ 17.14 $ 18.34
Ratio of earnings to fixed charges 4.01 2.91 6.03 2.97 2.29
Debt ratio 50.5% 47.5% 44.1% 42.1% 37.3%
Weighted-average common shares outstanding (000,000) 5,628 5,205 5,368 5,801 5,928
Weighted-average common shares outstanding
with dilution (000,000) 5,646 5,221 5,385 5,821 5,950
End of period common shares outstanding (000,000) 6,145 5,187 5,226 5,581 5,927
Operating Data
Total wireless customers (000) 137,324 120,554 110,376 106,957 103,247
Video connections (000) 37,934 5,943 5,460 4,536 3,791
In-region network access lines in service (000) 16,670 19,896 24,639 29,279 34,054
Broadband connections (000) 15,778 16,028 16,425 16,390 16,427
Number of employees 281,450 243,620 243,360 241,810 256,420
1
Financial data for 2011-2014 has been adjusted to reflect our change in accounting for customer fulfillment costs and the early adoption of ASU 2015-03 and ASU 2015-17.
See Note 1 to our consolidated financial statements.


